
Quick Summary
The Greater Toronto Area housing market remained cautious in October 2026. According to TRREB, 5,603 homes sold, a 7.9% decline from October 2025. The average selling price was $1,024,108, down 2.7% year over year, while new listings fell 11.9% and active inventory declined 10%. Despite weaker annual results, seasonally adjusted market activity and pricing increased modestly compared with September. Inflation, a Bank of Canada rate increase and economic uncertainty continued to influence buyers. For homeowners, sellers and investors, the figures highlight the value of local market analysis rather than reliance on GTA-wide averages.
October 2026: A Housing Market Still Searching for Direction
The GTA housing market entered the final quarter of 2026 facing two competing forces: buyers concerned about affordability and economic uncertainty, and sellers confronting a market where attracting serious purchasers requires increasingly careful pricing.
The October figures show that demand remains weaker than a year earlier. However, new listings and active inventory have also contracted. A market with fewer buyers and an even greater reduction in new supply can behave very differently from one where inventory keeps accumulating.
Rather than announcing an outright recovery or a renewed downturn, October's evidence points to a market adjusting to changing financing conditions and cautious consumer sentiment.
GTA Housing Market: October 2026 Statistics
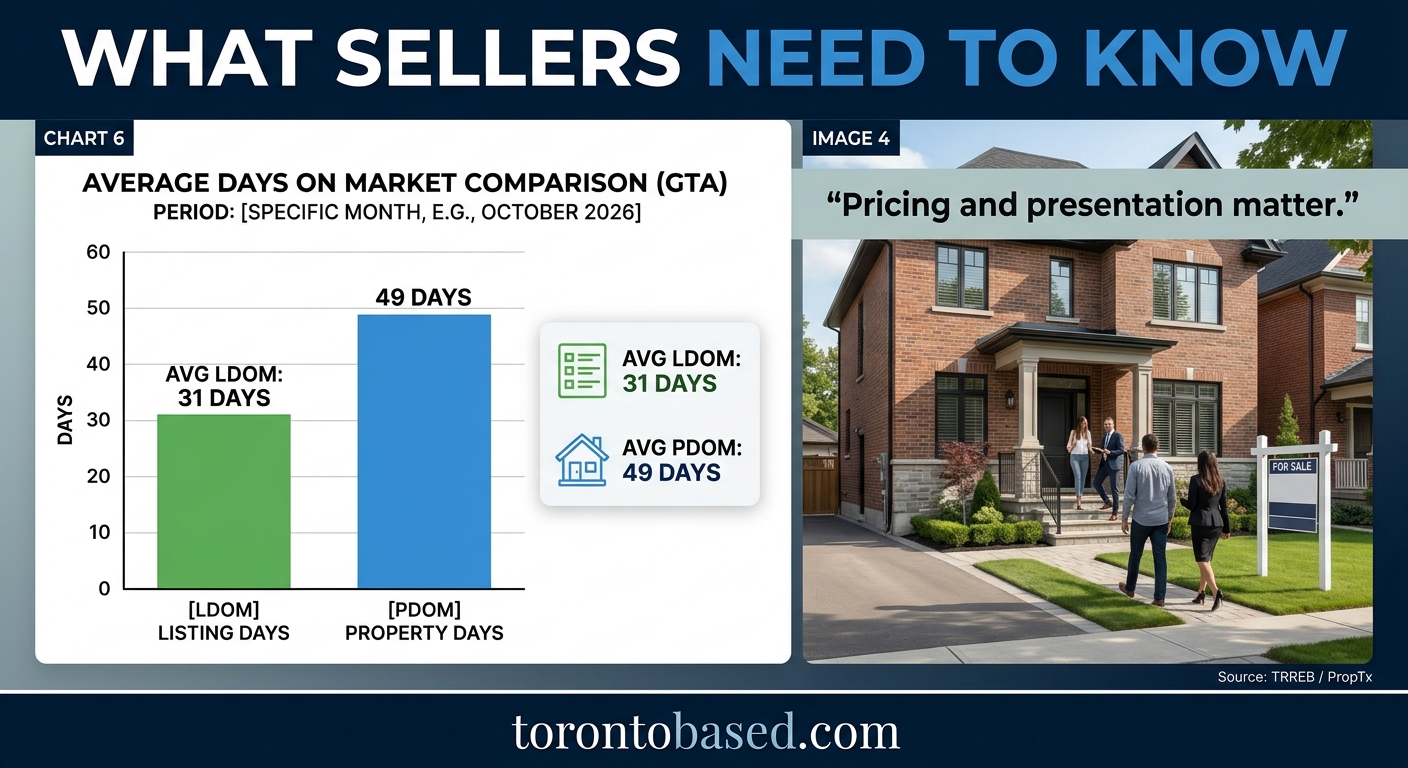
TRREB reported 5,603 firm sales, an average price of $1,024,108, 14,173 new listings and 25,098 active listings. The MLS HPI Composite benchmark was down 4.3% year over year. Average LDOM was 31 days and average PDOM was 49 days.
Why Are Home Sales Declining?
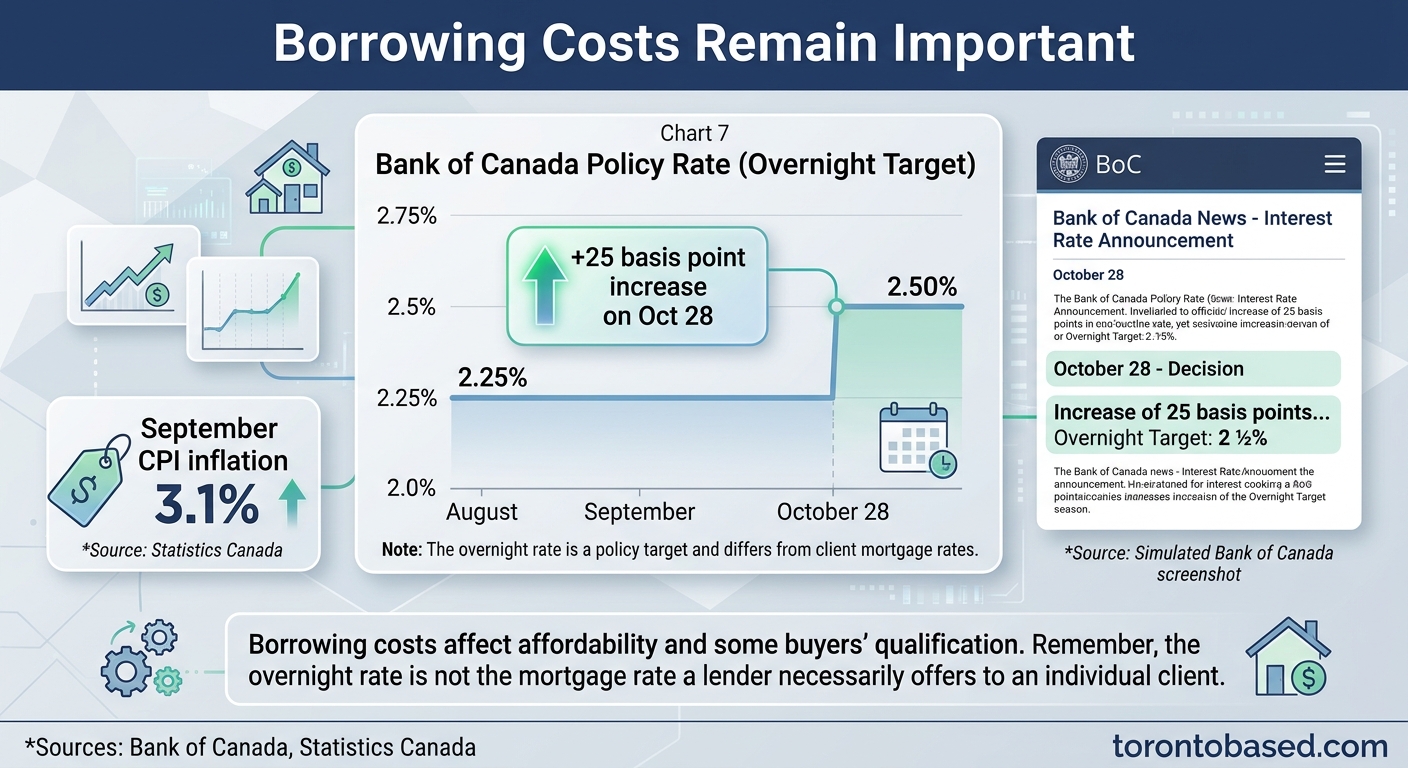
Sales dropped from 6,083 in October 2025 to 5,603 in October 2026. The decline means fewer transactions were completed, not that nobody wants to buy. Financing uncertainty is an important consideration. On October 28 the Bank of Canada raised its policy rate to 2.50%. Some potential buyers may be reassessing qualification, monthly costs and job security. Others may be waiting for greater clarity about future rates.
The market is not experiencing identical conditions in every community. Well-presented, competitively priced properties can still attract serious interest even when aggregate sales volumes decline.
GTA Home Prices: What Does the 2.7% Decline Really Mean?

The average selling price declined from $1,052,539 to $1,024,108—a difference of $28,431. However, average prices are influenced by which properties sell. A smaller share of high-value detached transactions can affect the overall average without representing the same percentage change for every home.
TRREB's MLS HPI Composite benchmark declined 4.3% year over year, offering a different measure of price movement. Seasonally adjusted benchmark and average prices edged higher from September, but that alone is insufficient evidence of a sustained recovery.
For homeowners, the GTA average is a market reference, not an appraisal. A property's estimated value requires recent comparable sales, competition, condition, size, location and buyer responses.
Fewer Listings: Could the Market Become More Balanced?
New listings fell 11.9%, from 16,080 to 14,173. Active listings declined 10%, to 25,098. These figures suggest that the supply side of the market is also contracting. Some owners may be delaying their plans, but monthly aggregate data cannot establish the motivations of individual sellers.
Shrinking supply can reduce buyer choice. Whether that eventually produces stronger prices depends on qualified demand relative to available properties. October's evidence indicates a changing balance, not a guaranteed imminent price increase.
Toronto, York, Peel and Durham: Different Local Markets
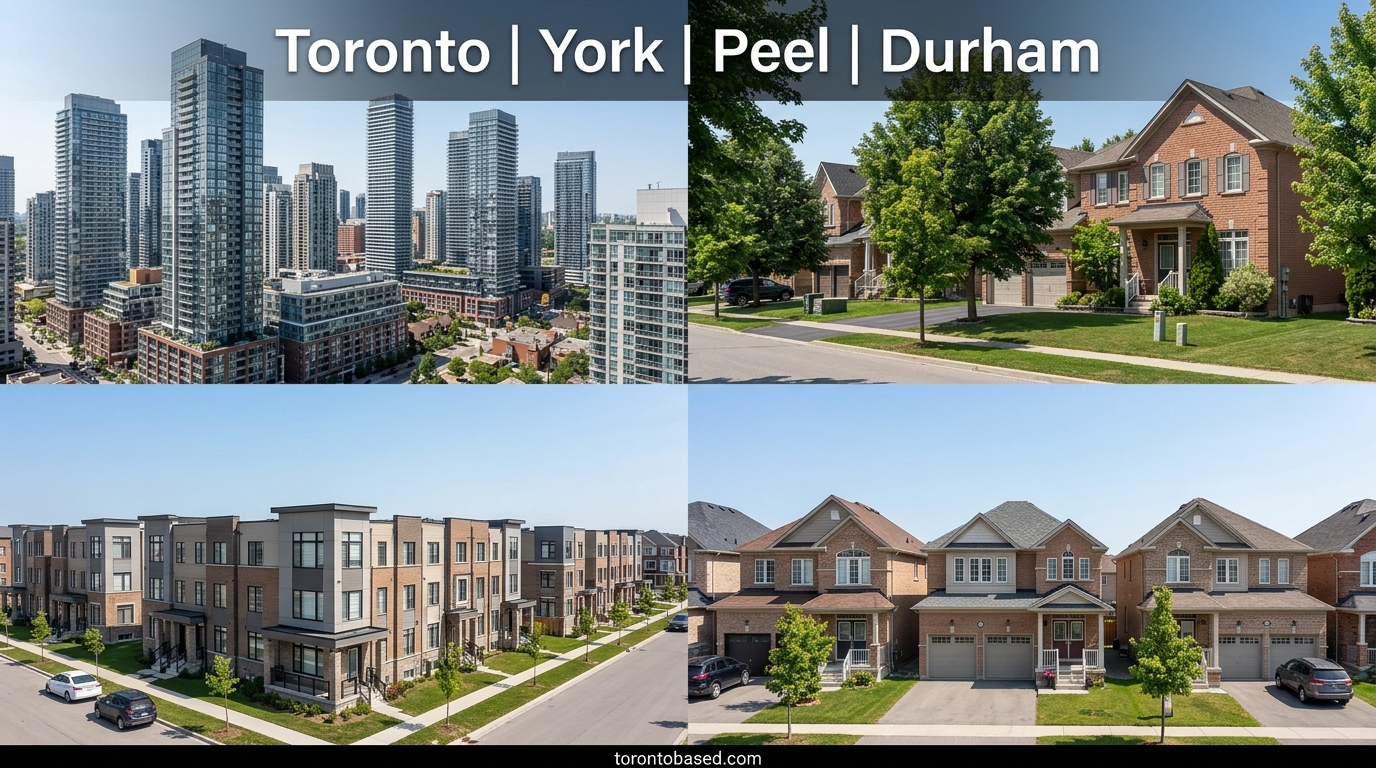
City of Toronto recorded 2,184 sales at an average selling price of $1,075,627; York Region recorded 1,038 sales at $1,142,789; Peel Region 1,017 at $898,431; Durham Region 589 at $793,024.
Toronto's market ranges from condominium apartments to expensive detached homes. Toronto Central averaged $1,185,407, Toronto East $948,682 and Toronto West $982,813. Such differences describe the mix of homes sold, not location premiums for otherwise identical properties.
York encompasses Markham, Richmond Hill, Vaughan, Aurora and other distinct municipalities. Peel includes Mississauga, Brampton and Caledon. Durham includes Pickering, Ajax, Whitby, Oshawa and Clarington. In every area, local comparable transactions matter more than a broad regional average for a particular purchase or listing.
Interest Rates, Inflation and Consumer Confidence
The Bank of Canada increased the overnight policy rate from 2.25% to 2.50% on October 28, 2026. September annual CPI inflation was 3.1%. Higher financing costs can affect qualification and purchasing budgets; inflation may also constrain the amount of income households can commit to housing. Fixed and variable mortgage products respond differently, and actual borrower terms vary by lender and borrower.
What October 2026 Means for Home Sellers
Sellers should price with recent firm comparable sales and current competition rather than relying on older market peaks. Buyers compare condition, size, floor plan, location, renovation costs and alternatives. Property preparation, photography, staging and a targeted marketing strategy can help a listing stand out.
Track market response and time on market closely. For owners planning to purchase another property, evaluate the entire move—including financing, carrying costs and replacement-property pricing—not just the sale-price headline.
What October 2026 Means for Buyers
Buyers may find negotiating opportunities in some segments but should begin with total affordability. In addition to mortgage payments, account for taxes, insurance, utilities, condominium fees, maintenance, closing costs and cash reserves. Review recent sales and complete suitable financing and property due diligence. Purchasing a suitable property at a sustainable cost matters more than trying to predict an exact market bottom.
What Investors Should Consider
Lower purchase prices do not automatically produce attractive investment returns. Evaluate rent, operating expenses, vacancy, financing, maintenance, taxes and applicable regulations. Model cash flow separately from speculative appreciation.
What Could Happen in 2027?
If inflation moderates and borrowing costs stabilize, confidence could improve. If uncertainty or financing costs rise further, activity may remain subdued. Continued reductions in new listings could tighten some neighbourhood markets. These are scenarios, not forecasts. The December 9 Bank of Canada decision and upcoming TRREB reports should be monitored.
Key Takeaways
1. GTA sales decreased 7.9% year over year.
2. Average price fell 2.7% to $1,024,108.
3. MLS HPI benchmark declined 4.3%.
4. New and active listings fell faster than sales.
5. Seasonally adjusted monthly indicators improved modestly.
6. Financing costs and economic confidence remain significant.
7. Sellers need local pricing and preparation strategies.
8. Buyers should focus on affordability and careful due diligence.
Frequently Asked Questions
What was the GTA average price? $1,024,108 in October 2026.
How many homes sold? 5,603, down 7.9% year over year.
Did prices increase? They remained lower annually, although seasonally adjusted averages rose modestly compared with September.
Is this a buyer's market? Conditions vary by neighbourhood and housing type; one GTA-wide statistic is insufficient to classify every submarket.
What was the Bank of Canada rate? 2.50% after October 28, 2026.
Should I sell now? Assess your local competition, objectives and finances.
Should I wait until 2027 to buy? There is no universally right answer; qualification, affordability and suitable inventory matter.
Conclusion
October 2026 reflects a GTA housing market still adjusting to economic uncertainty and changing borrowing costs. Annual sales and prices remain lower, but inventory declines and modest monthly improvements create a more nuanced picture. Buyers and sellers should base decisions on their specific neighbourhood, property type and financial objectives.
🏡 Ready to Start Your Real Estate Journey?
Whether you're planning to buy, sell, or invest, I’m here to guide you every step of the way — surprises and all.
📈 Looking to capitalize on today’s changing market?
Explore a wide range of specialized listings with access to powerful tools and search portals tailored to your needs:
Stay ahead of the curve. Get the latest real estate news and insights right here.
📩 Need help navigating your options?
Reach out for expert advice and market insights:
Sami Chowdhury
BROKER
📧 Email: samichy@torontobase.com
🌐 Web: www.torontobased.com | www.torontobase.ca
Let’s make your next move a smart one.
Get more market insights here:
· Toronto & GTA Housing Market — Sep 2026
· Toronto & GTA Housing Market — Aug 2026
The GTA Housing Market Is Changing: What May 2026 Means for Buyers, Sellers, and Investors
Bill 60 vs. Ontario’s Residential Tenancies Act (RTA): What’s Changing?
Stay ahead of the curve. Get the latest real estate news and insights right here.