
By Sami Chowdhury | Real Estate Broker | RE/MAX Realtron Realty Inc., Brokerage
The Greater Toronto Area housing market entered the fall of 2026 with fewer home sales, fewer new listings and lower selling prices compared with a year earlier. Yet behind those headline figures lies a more complicated real estate market than a simple story of rising or falling prices.
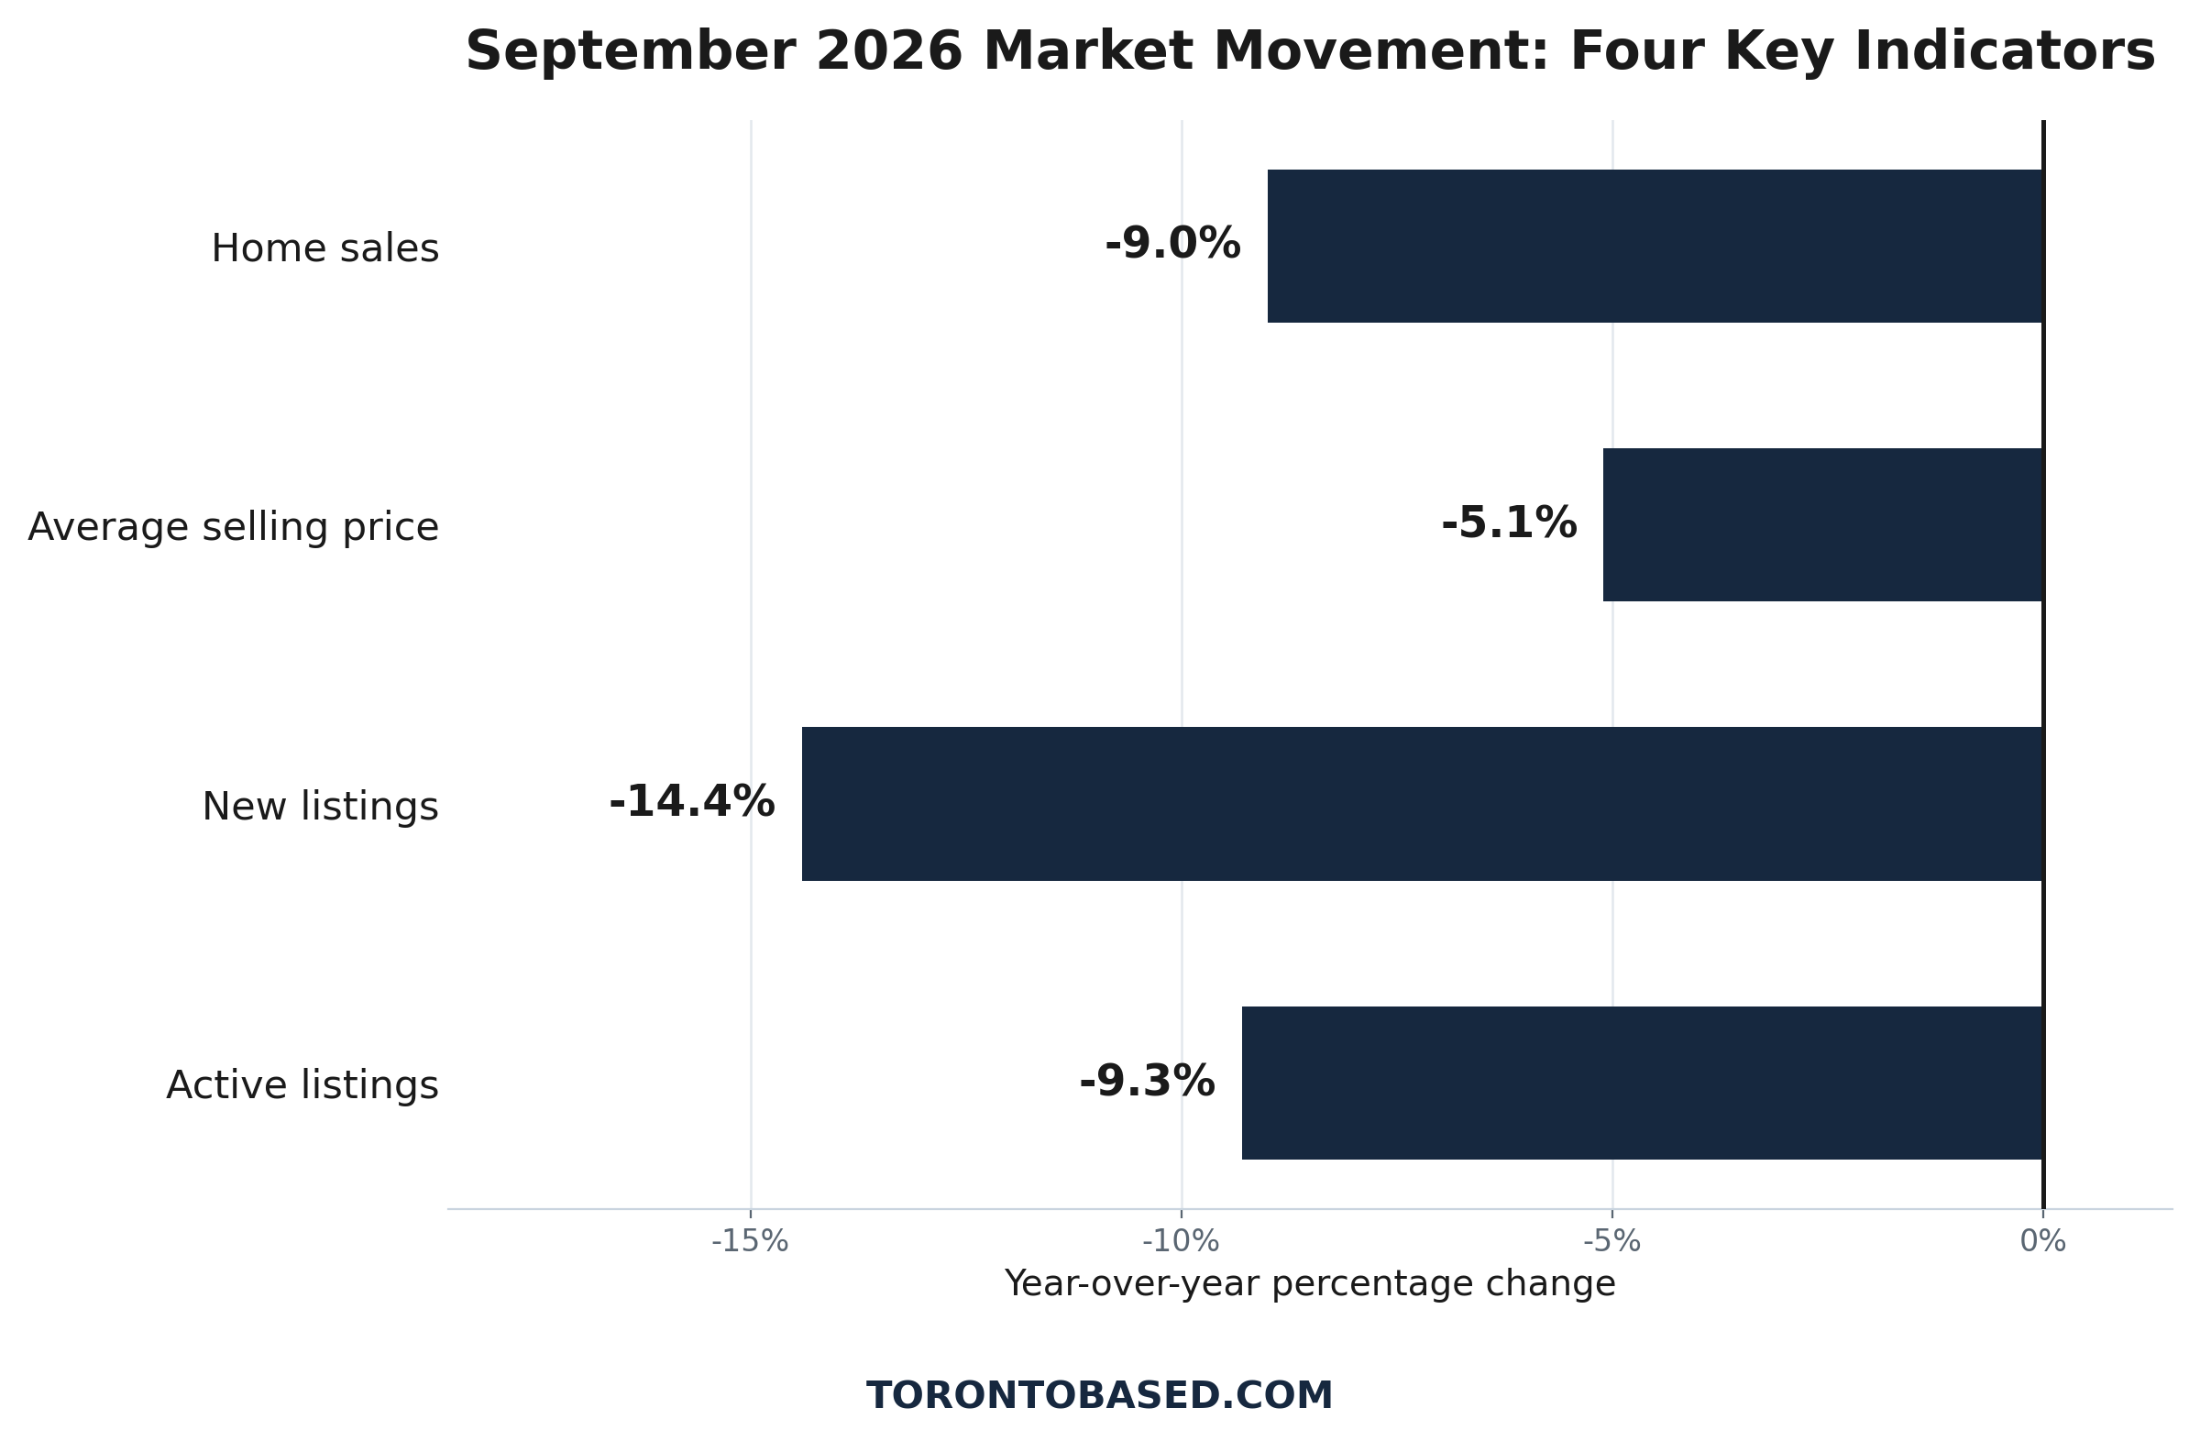
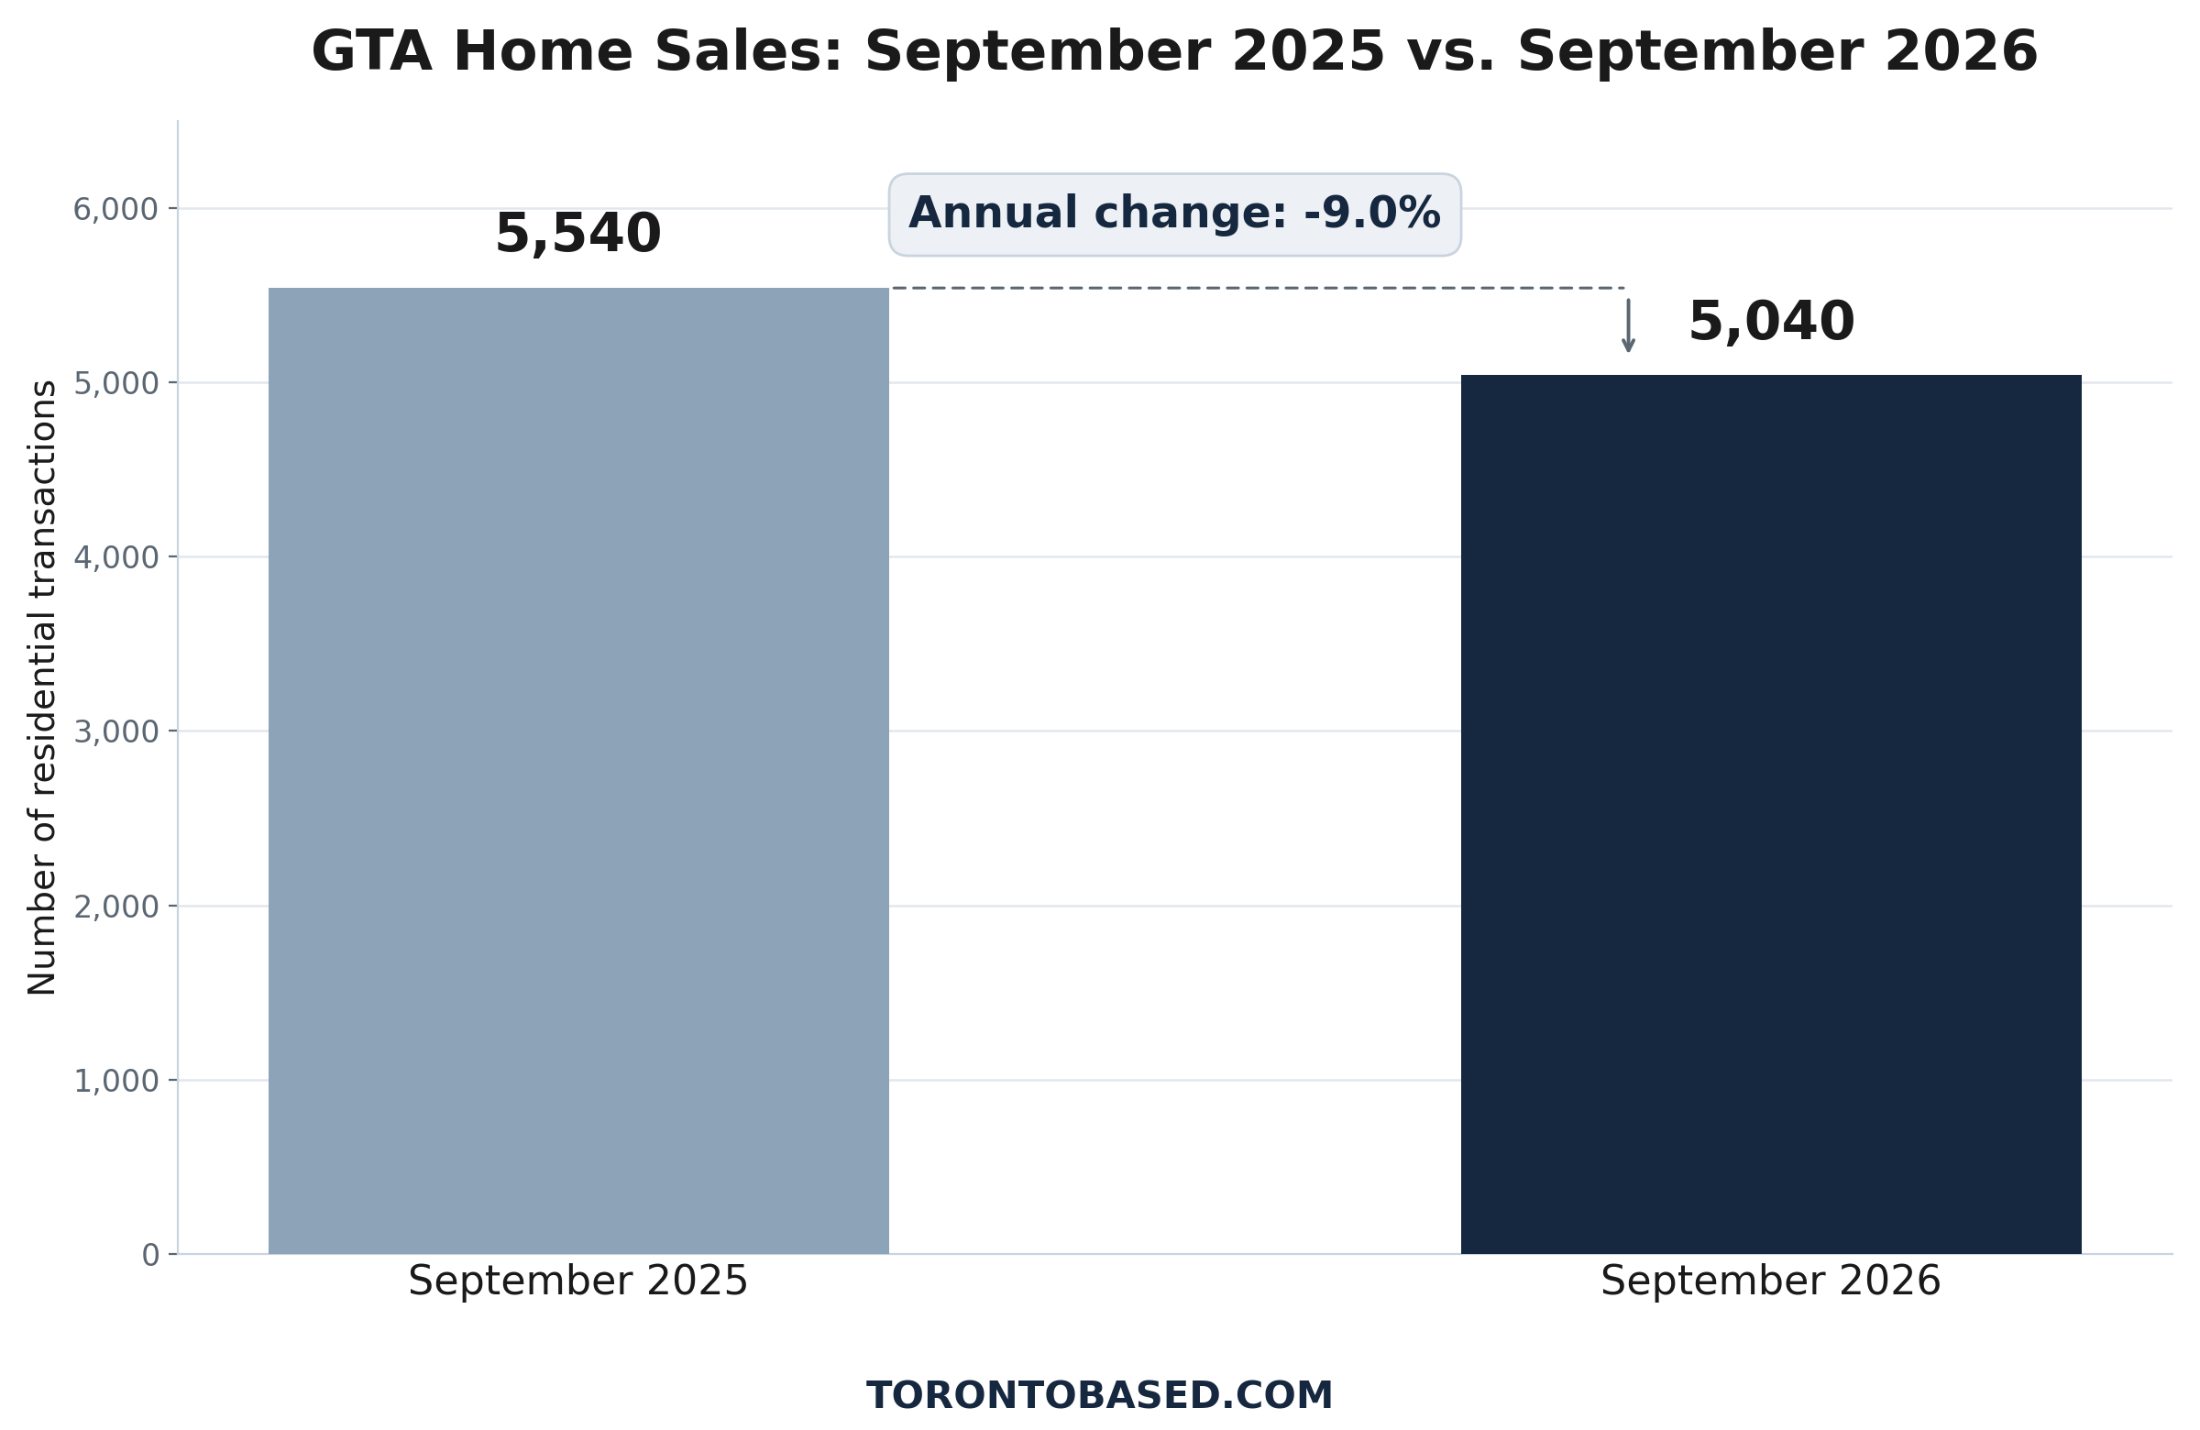
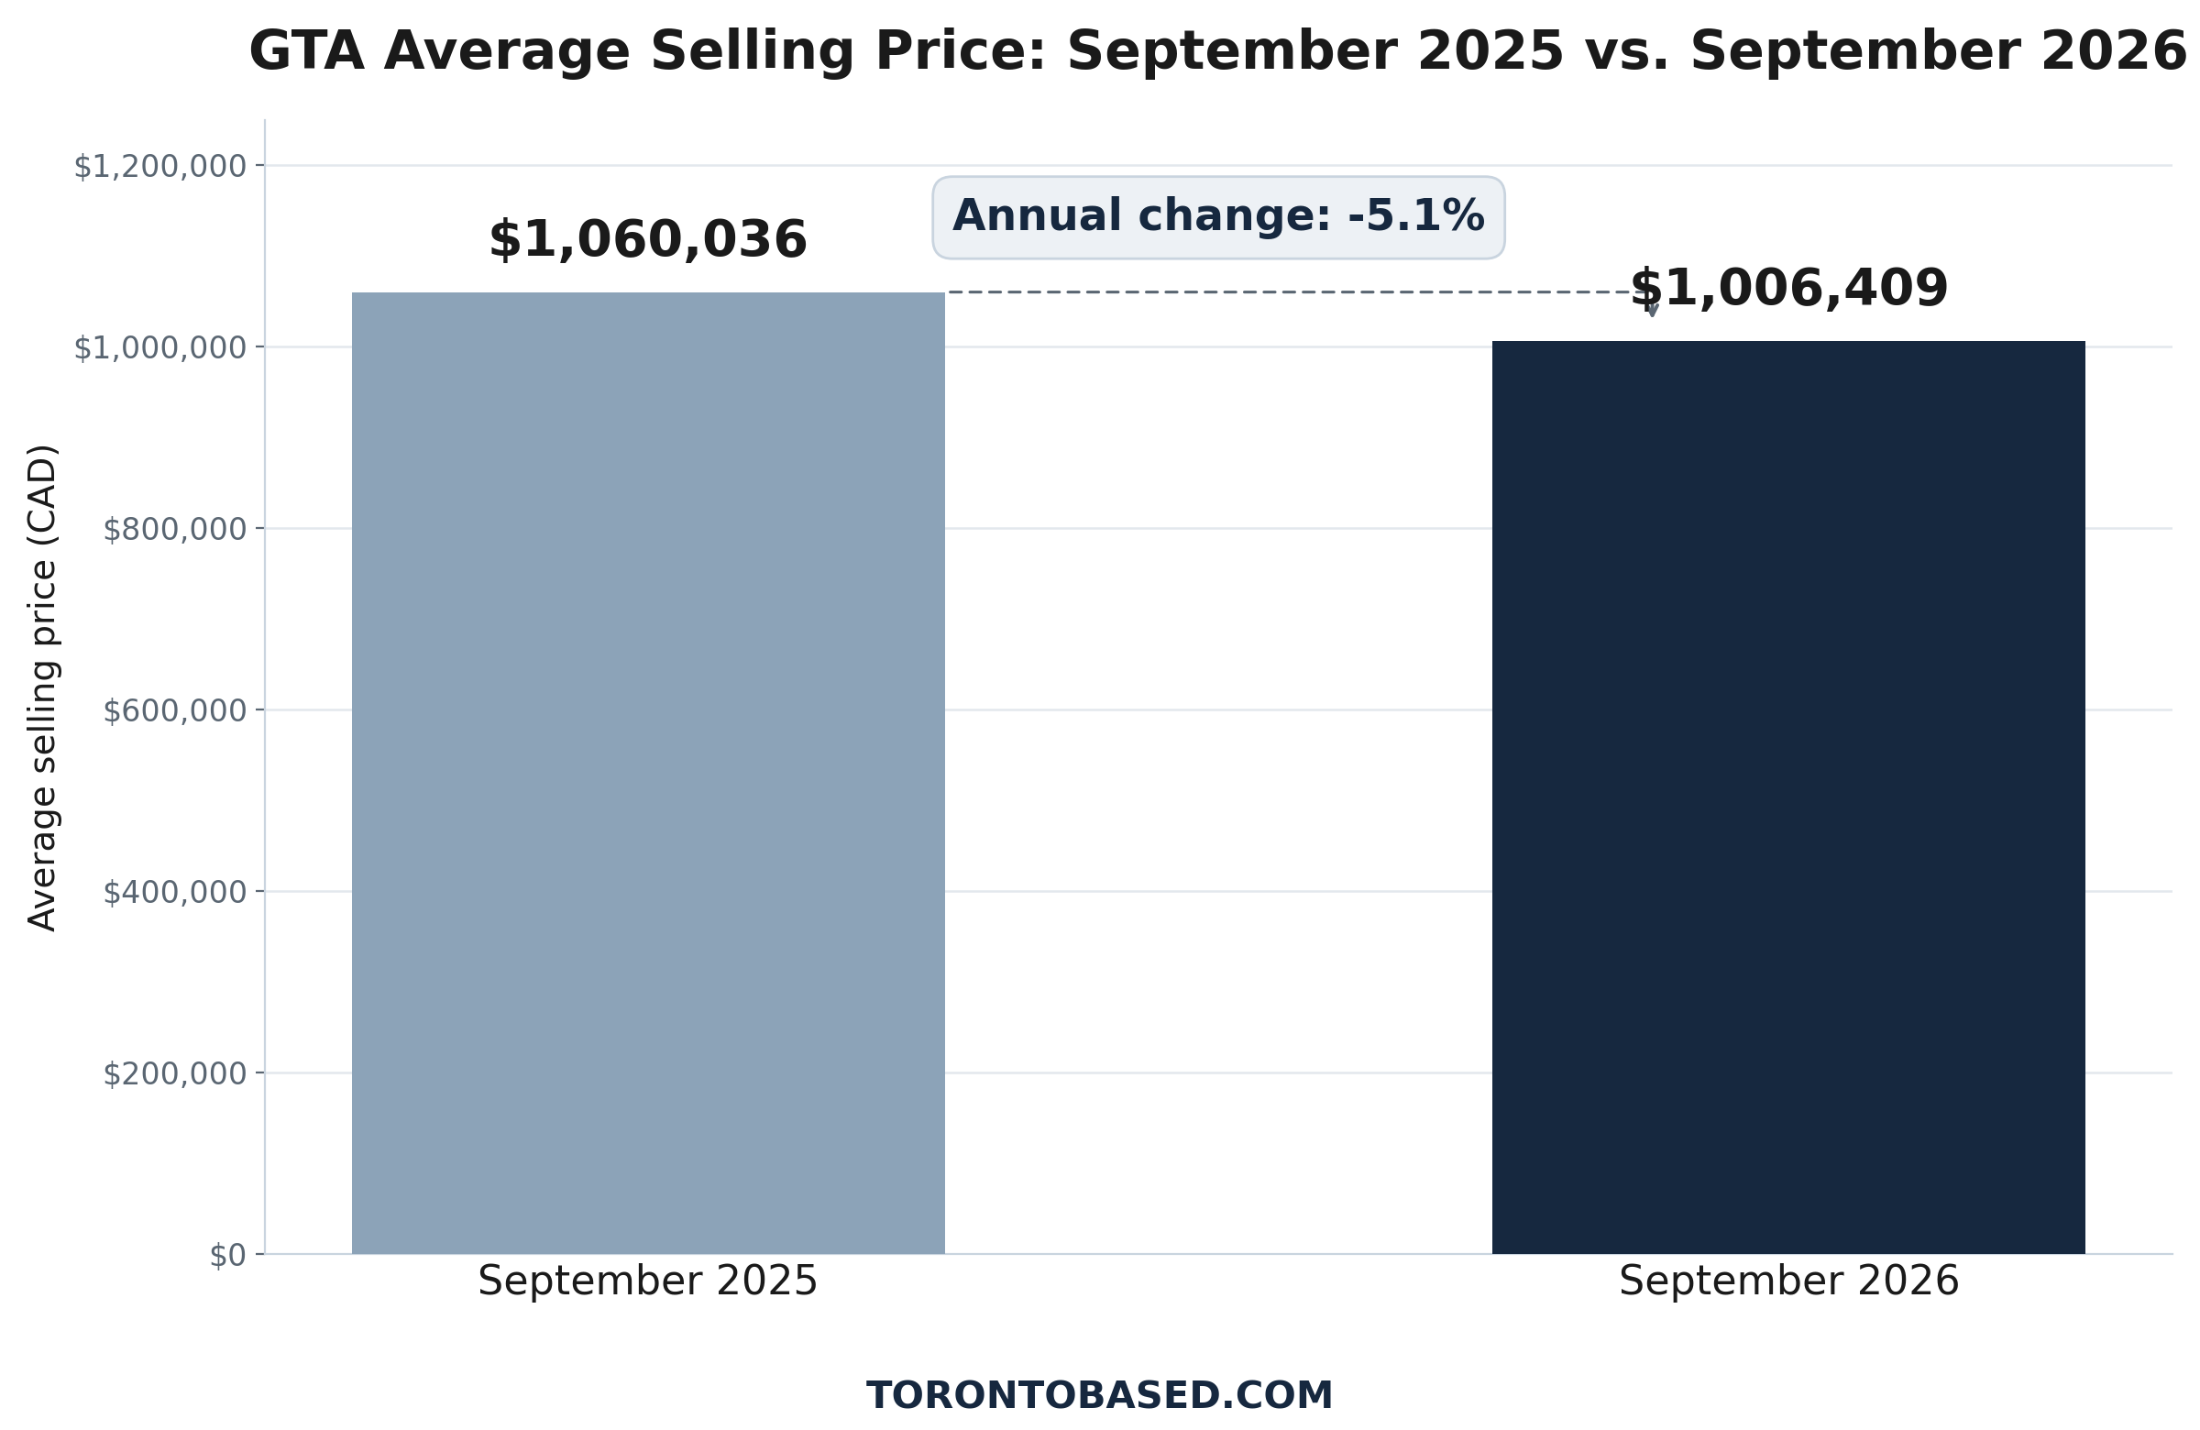
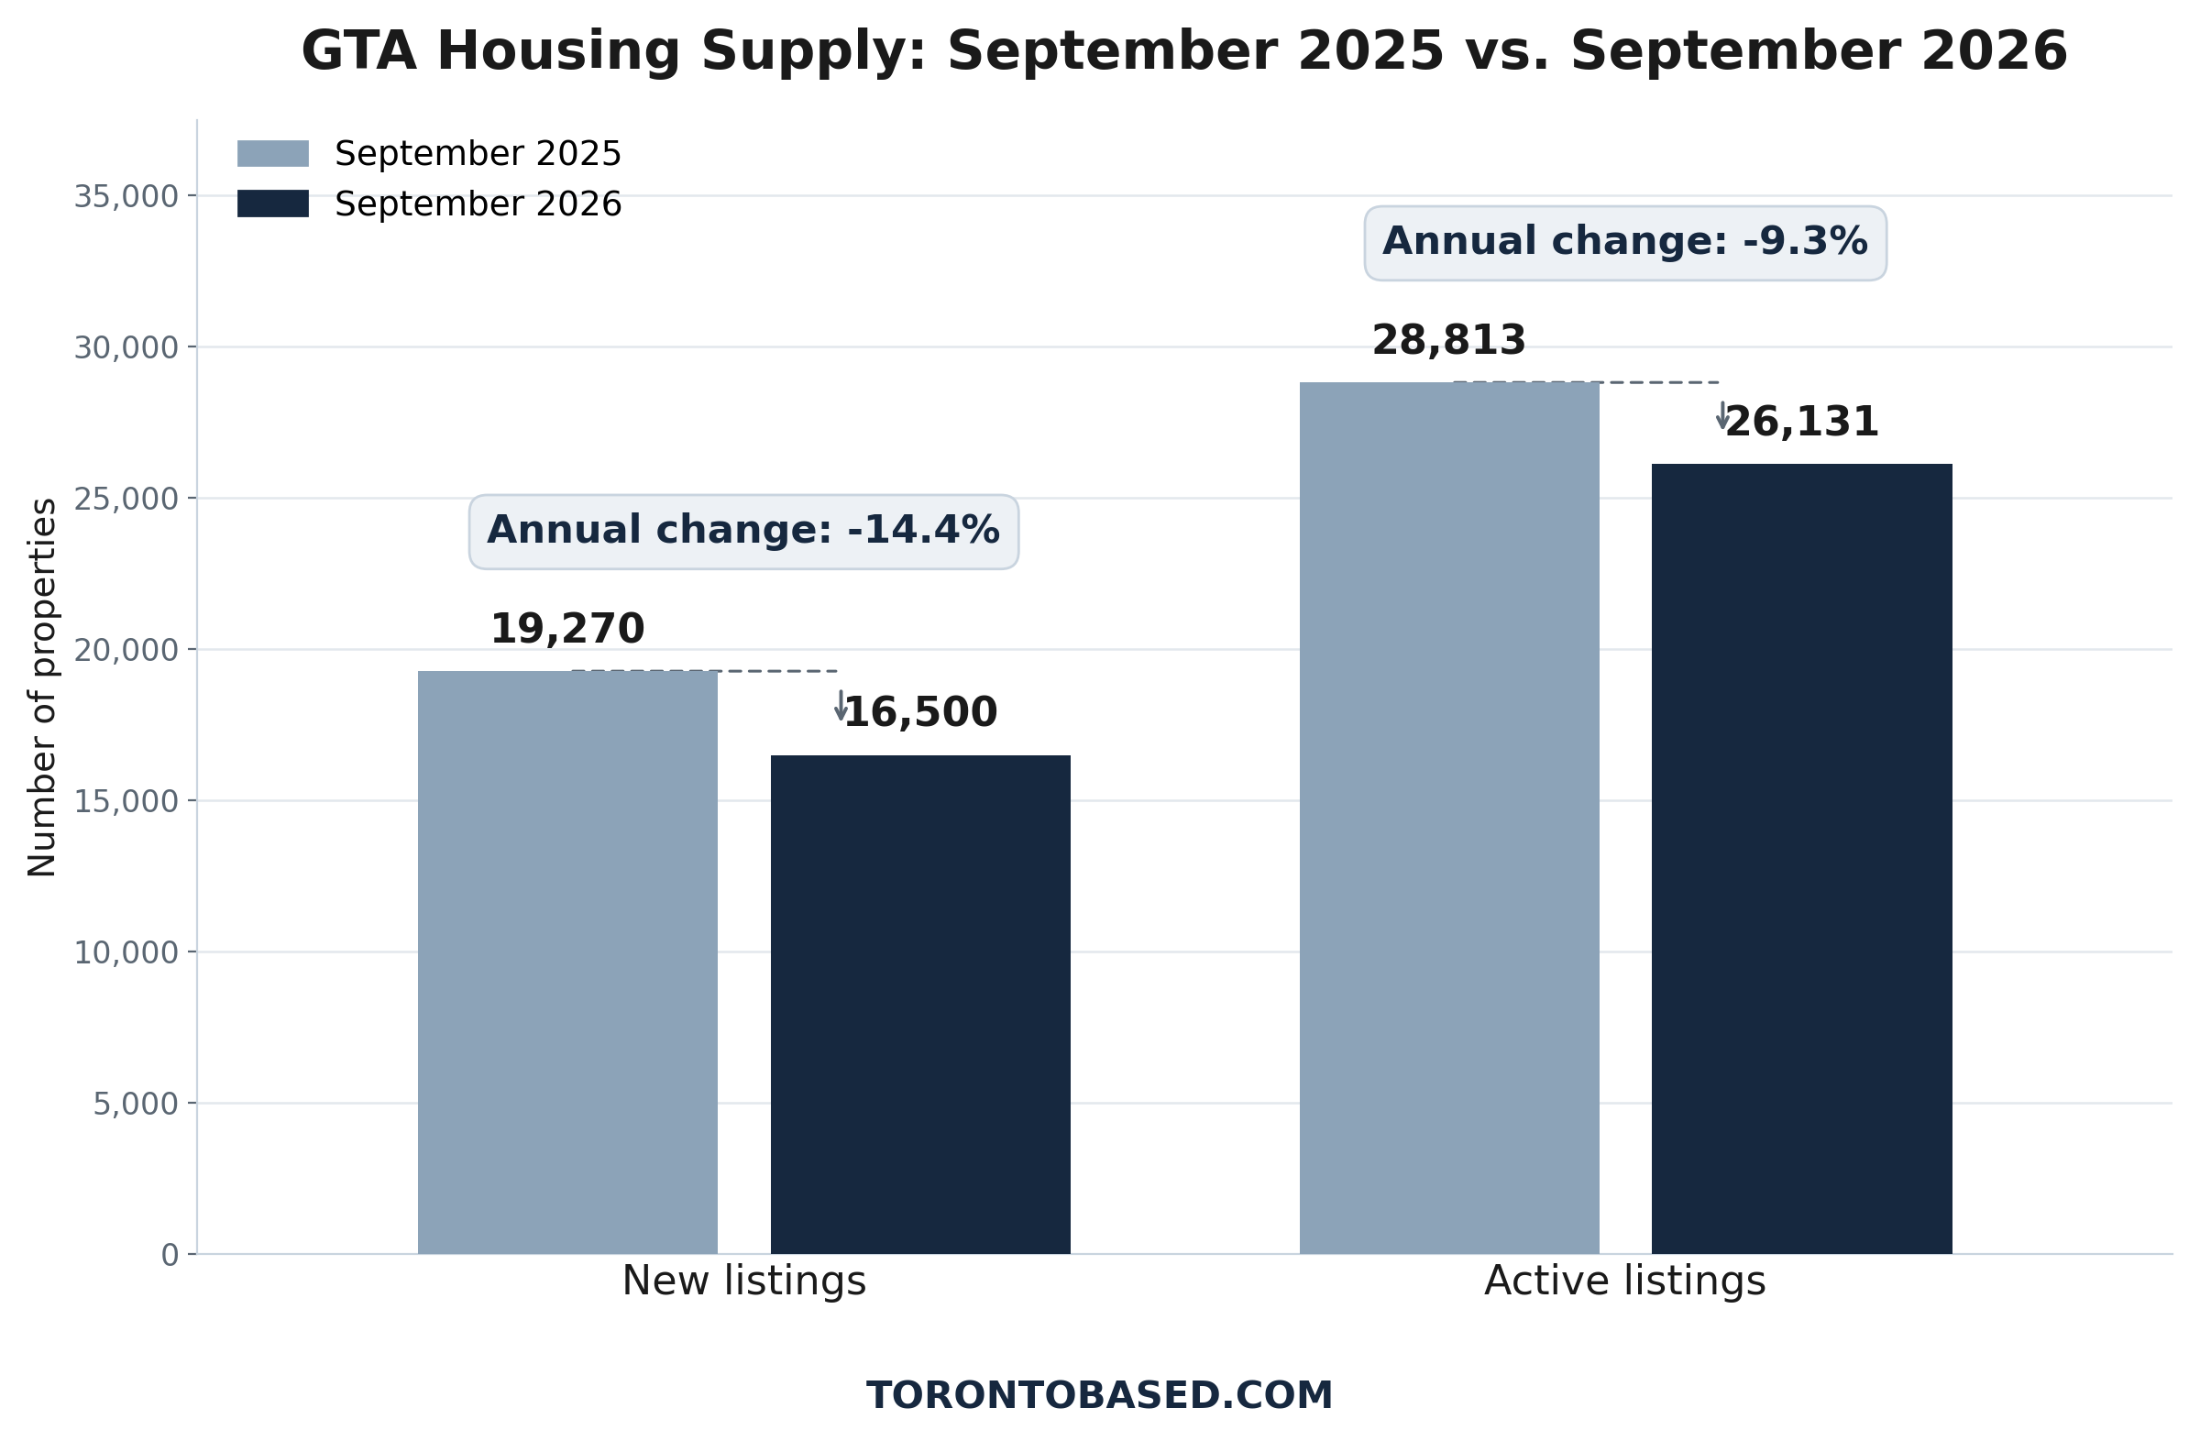
According to the Toronto Regional Real Estate Board (TRREB), 5,040 homes sold in September 2026, a 9.0% decline compared with September 2025. The average selling price fell 5.1% to $1,006,409, while new listings declined 14.4% to 16,500.
The MLS® Home Price Index Composite benchmark also declined by approximately 4.7% year over year, confirming that the weakness was not limited to changes in the mix of properties being sold.
One of the more revealing developments was the reduction in housing inventory. Active listings dropped 9.3% from a year earlier, even though buyer activity also weakened.
This raises an important question.
If fewer homes were available for sale, why did prices continue to decline?
The answer involves more than supply. Buyer confidence, mortgage affordability, employment uncertainty, local competition and the difference between what sellers expect and what buyers are willing to pay all help explain the market.
For homeowners considering selling, buyers planning a purchase, and investors evaluating opportunities, September's numbers provide valuable insight into how the GTA housing market is changing.
Quick Summary: September 2026 GTA Housing Market
Home sales: 5,040, down 9.0% year over year.
Average selling price: $1,006,409, down 5.1%.
Median selling price: $860,000.
New listings: 16,500, down 14.4%.
Active listings: 26,131, down 9.3%.
MLS® HPI Composite benchmark: $917,600, down 4.65%.
Average listing days on market: 34 days.
Average property days on market: 51 days.
Average sale-to-list-price ratio: 98%.
TRREB sales-to-new-listings ratio trend: 37.8%.
TRREB months-of-inventory trend: 4.6 months.
Source: TRREB Market Watch, September 2026, pages 1–3. Trend measures use TRREB's reported moving-average methodology.
What homeowners should understand: The GTA housing market has become more selective. Buyers are still purchasing properties, but lower market-wide prices and sales activity show that many are approaching decisions carefully. Sellers need accurate pricing and strong presentation, while buyers have opportunities to negotiate where listings are not attracting sufficient demand.
What Really Happened in the GTA Housing Market in September 2026?
The most important development was the simultaneous decline in sales activity, new listings, active inventory and selling prices.
At first glance, the figures may appear contradictory.
Usually, when housing supply decreases, some buyers face greater competition because fewer properties are available. If demand remains stable or increases, that competition can place upward pressure on prices.
September did not follow that simple pattern.
Sales declined by 9.0%, showing that fewer transactions were completed. Meanwhile, new listings declined even faster, falling 14.4%.
This suggests that both buyers and sellers were responding cautiously to market conditions.
Some buyers may have delayed purchases because of concerns about employment security, mortgage payments or future home values. Some homeowners may have postponed selling because market prices were below their expectations.
These are plausible interpretations of the activity, not independently measured reasons for each household's decision.
The essential point is that lower inventory was not enough to reverse the decline in prices.
Fewer transactions do not mean buyers have disappeared
A total of 5,040 residential transactions still represents meaningful market activity.
Families continued to move, first-time buyers entered homeownership, existing owners purchased their next properties, and investors evaluated acquisitions.
However, buyers were operating in a market where they could often compare competing properties rather than assuming every attractive listing would immediately receive several offers.
This changes the relationship between price and value.
A property may be desirable, well maintained and located in an established neighbourhood, but if its asking price is significantly above competing alternatives, buyers may simply continue searching.
A seller's desired price does not automatically become the market value.
Similarly, a buyer's expectation of a large discount does not guarantee that a well-priced property will sell below asking.
The actual result depends on the available alternatives, the property itself and the strength of demand in that particular market segment.
A market of negotiation rather than broad urgency
September's figures suggest that negotiation remained an important part of the purchasing process.
The GTA-wide average selling-price-to-listing-price ratio was 98%.
This means the average relationship between selling prices and asking prices was below 100%, but the figure should not be interpreted as a universal discount available on every home.
Some properties sold above asking. Others sold substantially below their original asking prices. The reported ratio reflects average selling prices relative to listing prices at the time of sale.
For buyers, this creates an opportunity to evaluate value carefully.
For sellers, it creates a need to understand how buyers compare available properties.
The market is not simply rewarding homeowners for listing a property. It is responding to properties that offer convincing value.
GTA Home Prices: Why the Average and Benchmark Both Matter
The average selling price in September 2026 was $1,006,409, compared with $1,060,036 in September 2025.
That represents an annual decline of approximately 5.1%.
However, the average selling price is only one measure of market performance.
TRREB also reported an MLS® HPI Composite benchmark of $917,600, down 4.65% from a year earlier.
Understanding the distinction is important when interpreting housing market headlines.
Average selling price
The average selling price is calculated from the selling prices of homes that actually changed hands during the reporting period.
It can be influenced by the number and types of homes sold.
For example, if a greater proportion of higher-priced detached homes are sold during a particular month, the average selling price can increase even if comparable individual properties have not meaningfully appreciated.
Conversely, if more lower-priced condominium apartments are sold, the average may decline.
This is why an increase or decrease in the GTA average does not automatically represent the same percentage change in every homeowner's property value.
MLS® Home Price Index
The MLS® HPI uses a standardized approach designed to track changes in housing values while accounting for differences in property characteristics.
In September, the benchmark for the composite market was $917,600.
The uploaded HPI data also provides benchmarks for different housing categories:
Source: TRREB Market Watch, September 2026, MLS® HPI table.
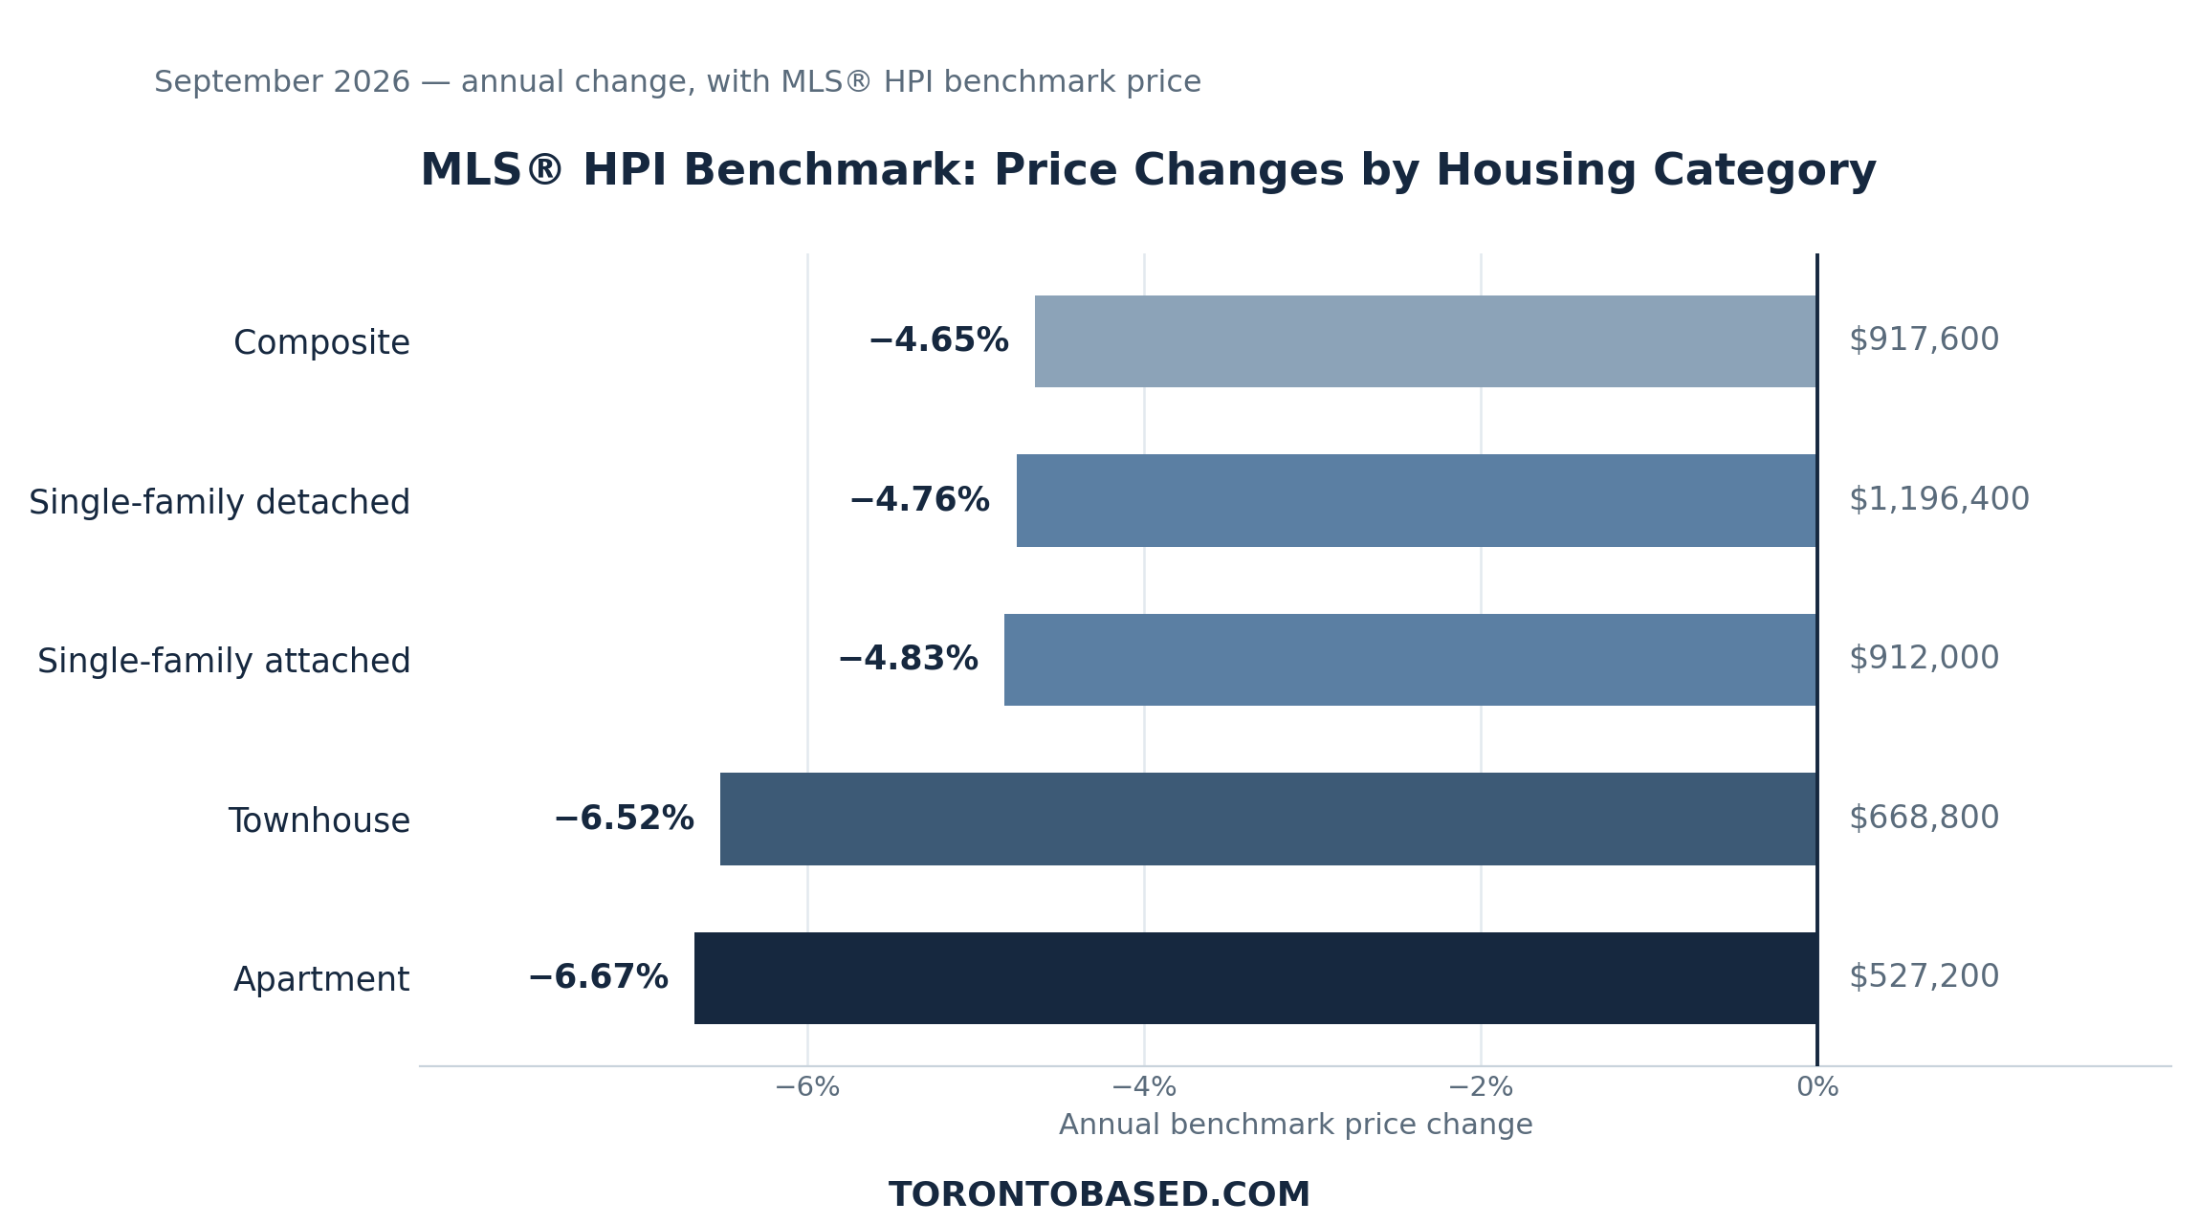
These figures show that benchmark prices declined across the major categories.
The townhouse and apartment benchmark segments recorded larger annual declines than the detached and attached categories.
That distinction is particularly relevant for buyers considering different property types and for owners planning to move between condominium and freehold housing.
Did prices increase from August?
The unadjusted average selling price increased from $993,604 in August 2026 to $1,006,409 in September.
That represents an increase of approximately 1.29% on the raw monthly figures.
It would be tempting to describe this as evidence that the market was recovering.
However, TRREB reported that both its seasonally adjusted average selling price and the seasonally adjusted HPI Composite moved slightly lower compared with August.
These statements are not necessarily contradictory.
Unadjusted monthly averages can change because of seasonal sales patterns and the types of homes sold. Seasonally adjusted figures are intended to make comparisons across months more meaningful.
Therefore, September's unadjusted price increase should not be taken as proof of a broad market turnaround.
The more defensible interpretation is that pricing remained under pressure, despite some improvement in the raw average from August.
Housing Supply: Why Fewer Listings Did Not Produce Higher Prices
One of the strongest signals in the September report was the decline in available inventory.
New listings fell from 19,270 in September 2025 to 16,500 in September 2026.
Active listings declined from 28,813 to 26,131.
In isolation, fewer listings might appear beneficial for sellers.
But housing prices are influenced by the relationship between demand and supply, not simply the number of properties available.
If buyers become more cautious faster than supply adjusts, prices may continue to soften even when inventory decreases.
New listings versus active listings
New listings measure the properties introduced to the MLS® System during the reporting period.
Active listings represent properties that remained available at the end of the month.
The two figures answer different questions.
New listings indicate how much fresh supply entered the market. Active listings indicate how much choice remained available.
When both decline, the market may be receiving less new supply while also carrying a smaller total inventory.
That does not, by itself, determine whether buyers or sellers have the negotiating advantage.
Understanding the sales-to-new-listings ratio
TRREB reported a sales-to-new-listings ratio trend of 37.8% for September.
Its published methodology uses a 12-month moving average.
The ratio is useful because it compares demand with the flow of newly listed properties.
A lower ratio generally indicates that sales activity is relatively weak compared with incoming supply, while a higher ratio suggests a greater proportion of new supply is being absorbed through completed transactions.
However, the ratio should be assessed alongside active listings, prices and marketing times.
September's trend reading, combined with falling prices and subdued sales, supports the interpretation of a market where sellers still faced meaningful competition.
Understanding months of inventory
TRREB reported a months-of-inventory trend of 4.6 months.
This measure should be interpreted using the methodology supplied in Market Watch, rather than recalculating a single month's numbers and treating the result as equivalent.
A higher inventory measure can indicate that available supply would take longer to absorb at the applicable sales pace.
A lower measure may indicate tighter supply.
Nevertheless, the distribution of inventory is just as important as the market-wide figure.
A buyer seeking a detached home in an established residential neighbourhood may face a very different selection from someone searching for a downtown condominium.
Likewise, a seller competing against many similar condo units may experience greater pressure than a homeowner whose property has relatively few close substitutes.
There is no single inventory number that fully describes every GTA neighbourhood.
How Long Are GTA Homes Taking to Sell?
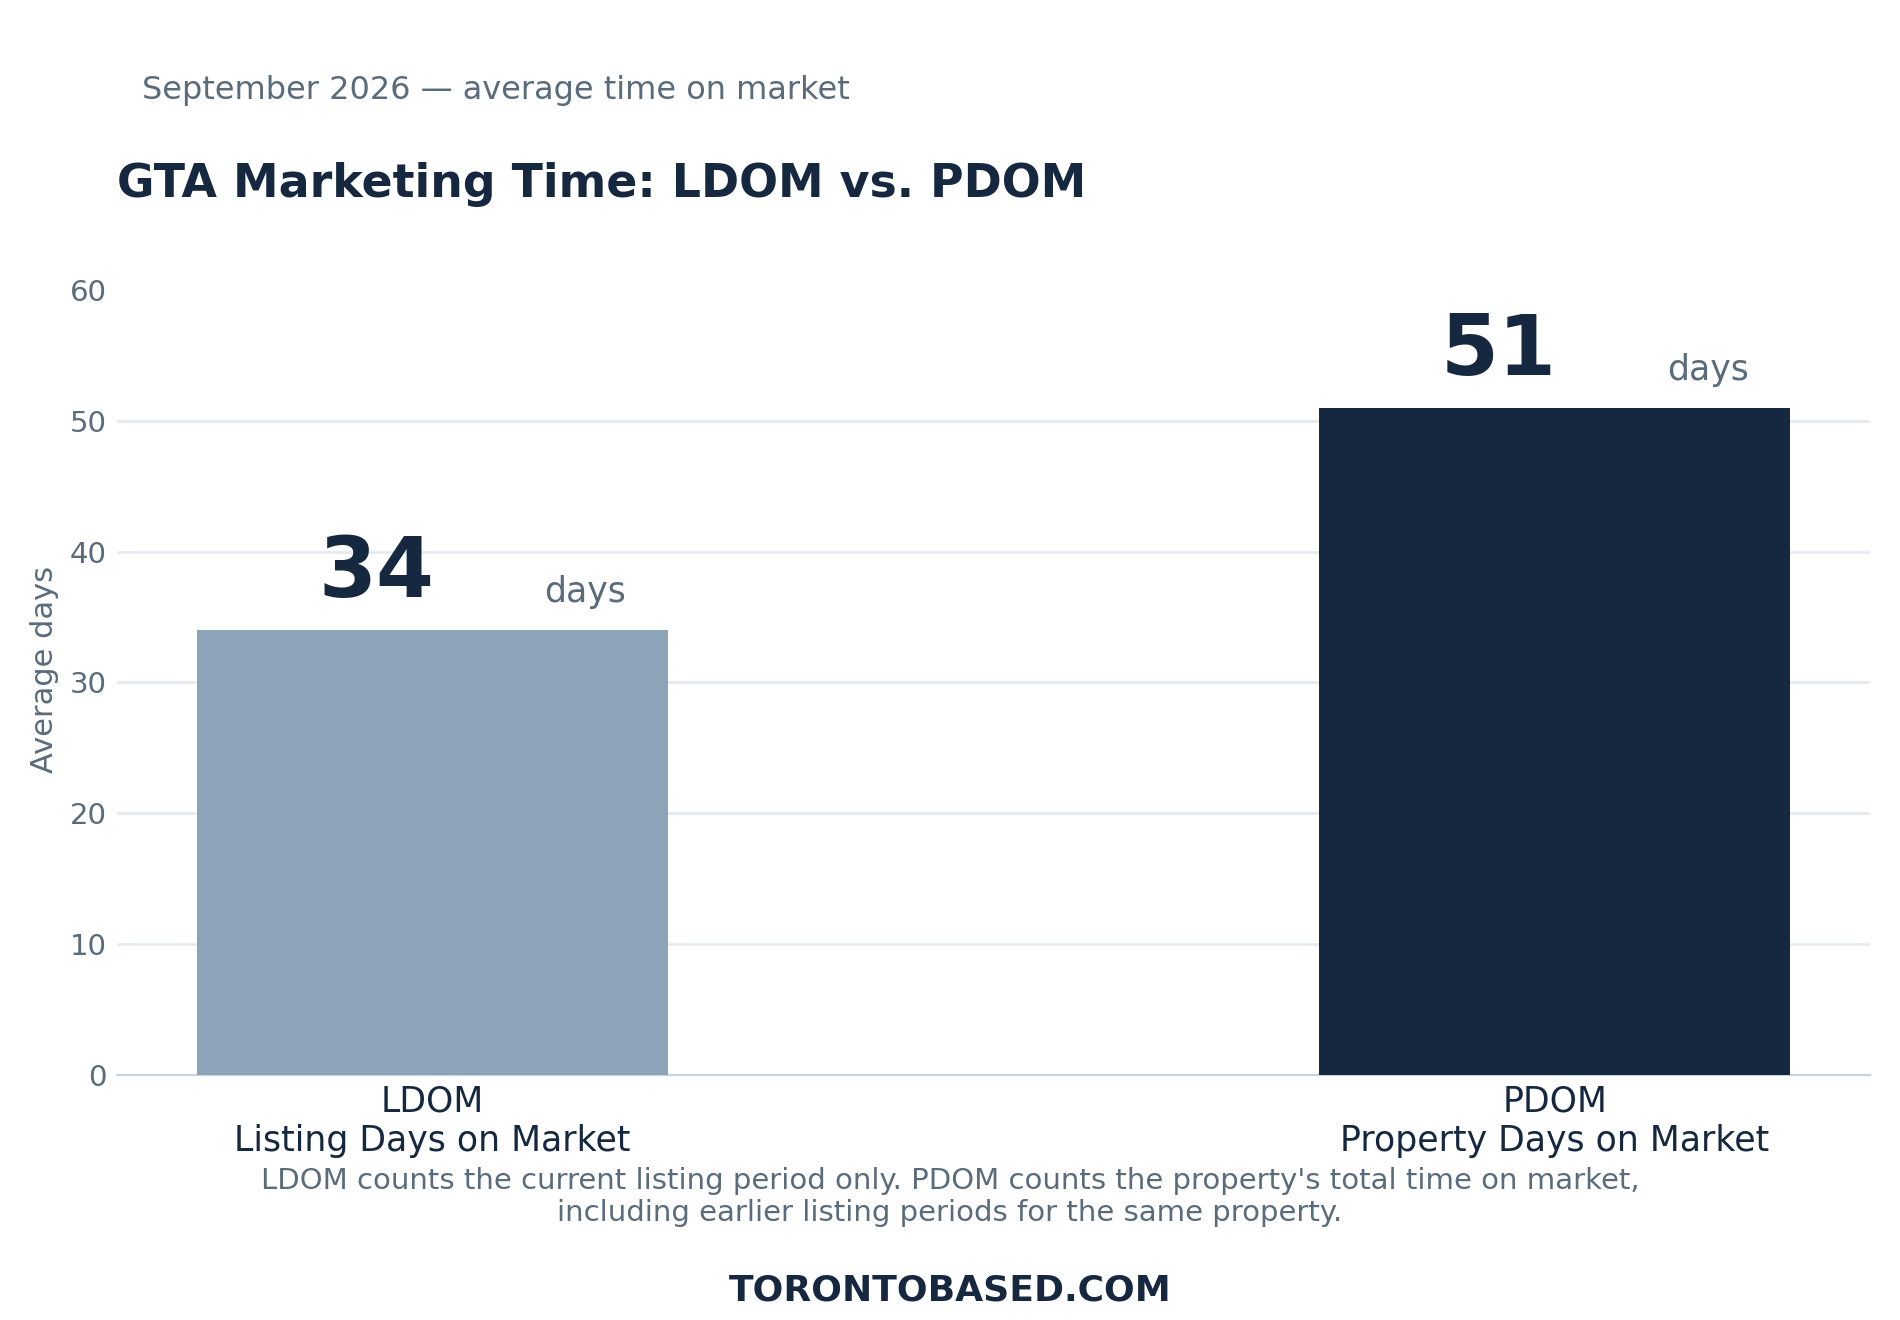
The average listing days on market reached 34 days in September 2026, compared with 33 days a year earlier.
At the same time, average property days on market remained at 51 days.
These two measures reveal an important aspect of seller behaviour and marketing strategy.
Listing Days on Market (LDOM)
LDOM measures the average number of days a sold listing spent on the market during the relevant listing period.
It is commonly used when comparing how quickly properties sell.
A lower number may indicate stronger buyer interest, effective pricing or limited competition.
A higher number may indicate that buyers are taking more time, or that listings are taking longer to reach an acceptable agreement.
However, an average does not reveal the entire range of outcomes.
Some homes may sell quickly. Others may remain listed for several months.
Property Days on Market (PDOM)
PDOM is designed to provide a broader measure of marketing exposure, including qualifying terminate-and-relist activity involving the same owner, brokerage and salesperson.
In September, the difference between the reported LDOM and PDOM averages was 17 days.
This difference matters because a property that appears newly listed may have had earlier exposure to the market.
A buyer reviewing the listing history may discover that the asking price was previously higher or that the property had been marketed before.
That information may influence the buyer's negotiation strategy.
For sellers, repeated relisting without addressing the reasons a property failed to sell can create the appearance of activity without necessarily generating stronger demand.
What sellers should learn from marketing time
The objective should not simply be to reduce days on market at any cost.
Instead, sellers should seek a balance between realistic pricing, adequate exposure and protection of their financial interests.
A carefully priced home supported by strong photographs, detailed listing information and effective buyer outreach may generate more meaningful interest than a home launched at an unrealistic price and repeatedly adjusted afterward.
Market exposure becomes especially important when buyers are comparing similar properties.
The longer a listing remains available, the more carefully its presentation and pricing should be reviewed against current competition.
Detached Homes, Townhouses and Condos: Different Markets, Different Decisions
The GTA housing market is not one uniform product.
A downtown condominium apartment, a suburban townhouse and a detached family home have different buyer profiles, ownership costs and competitive pressures.
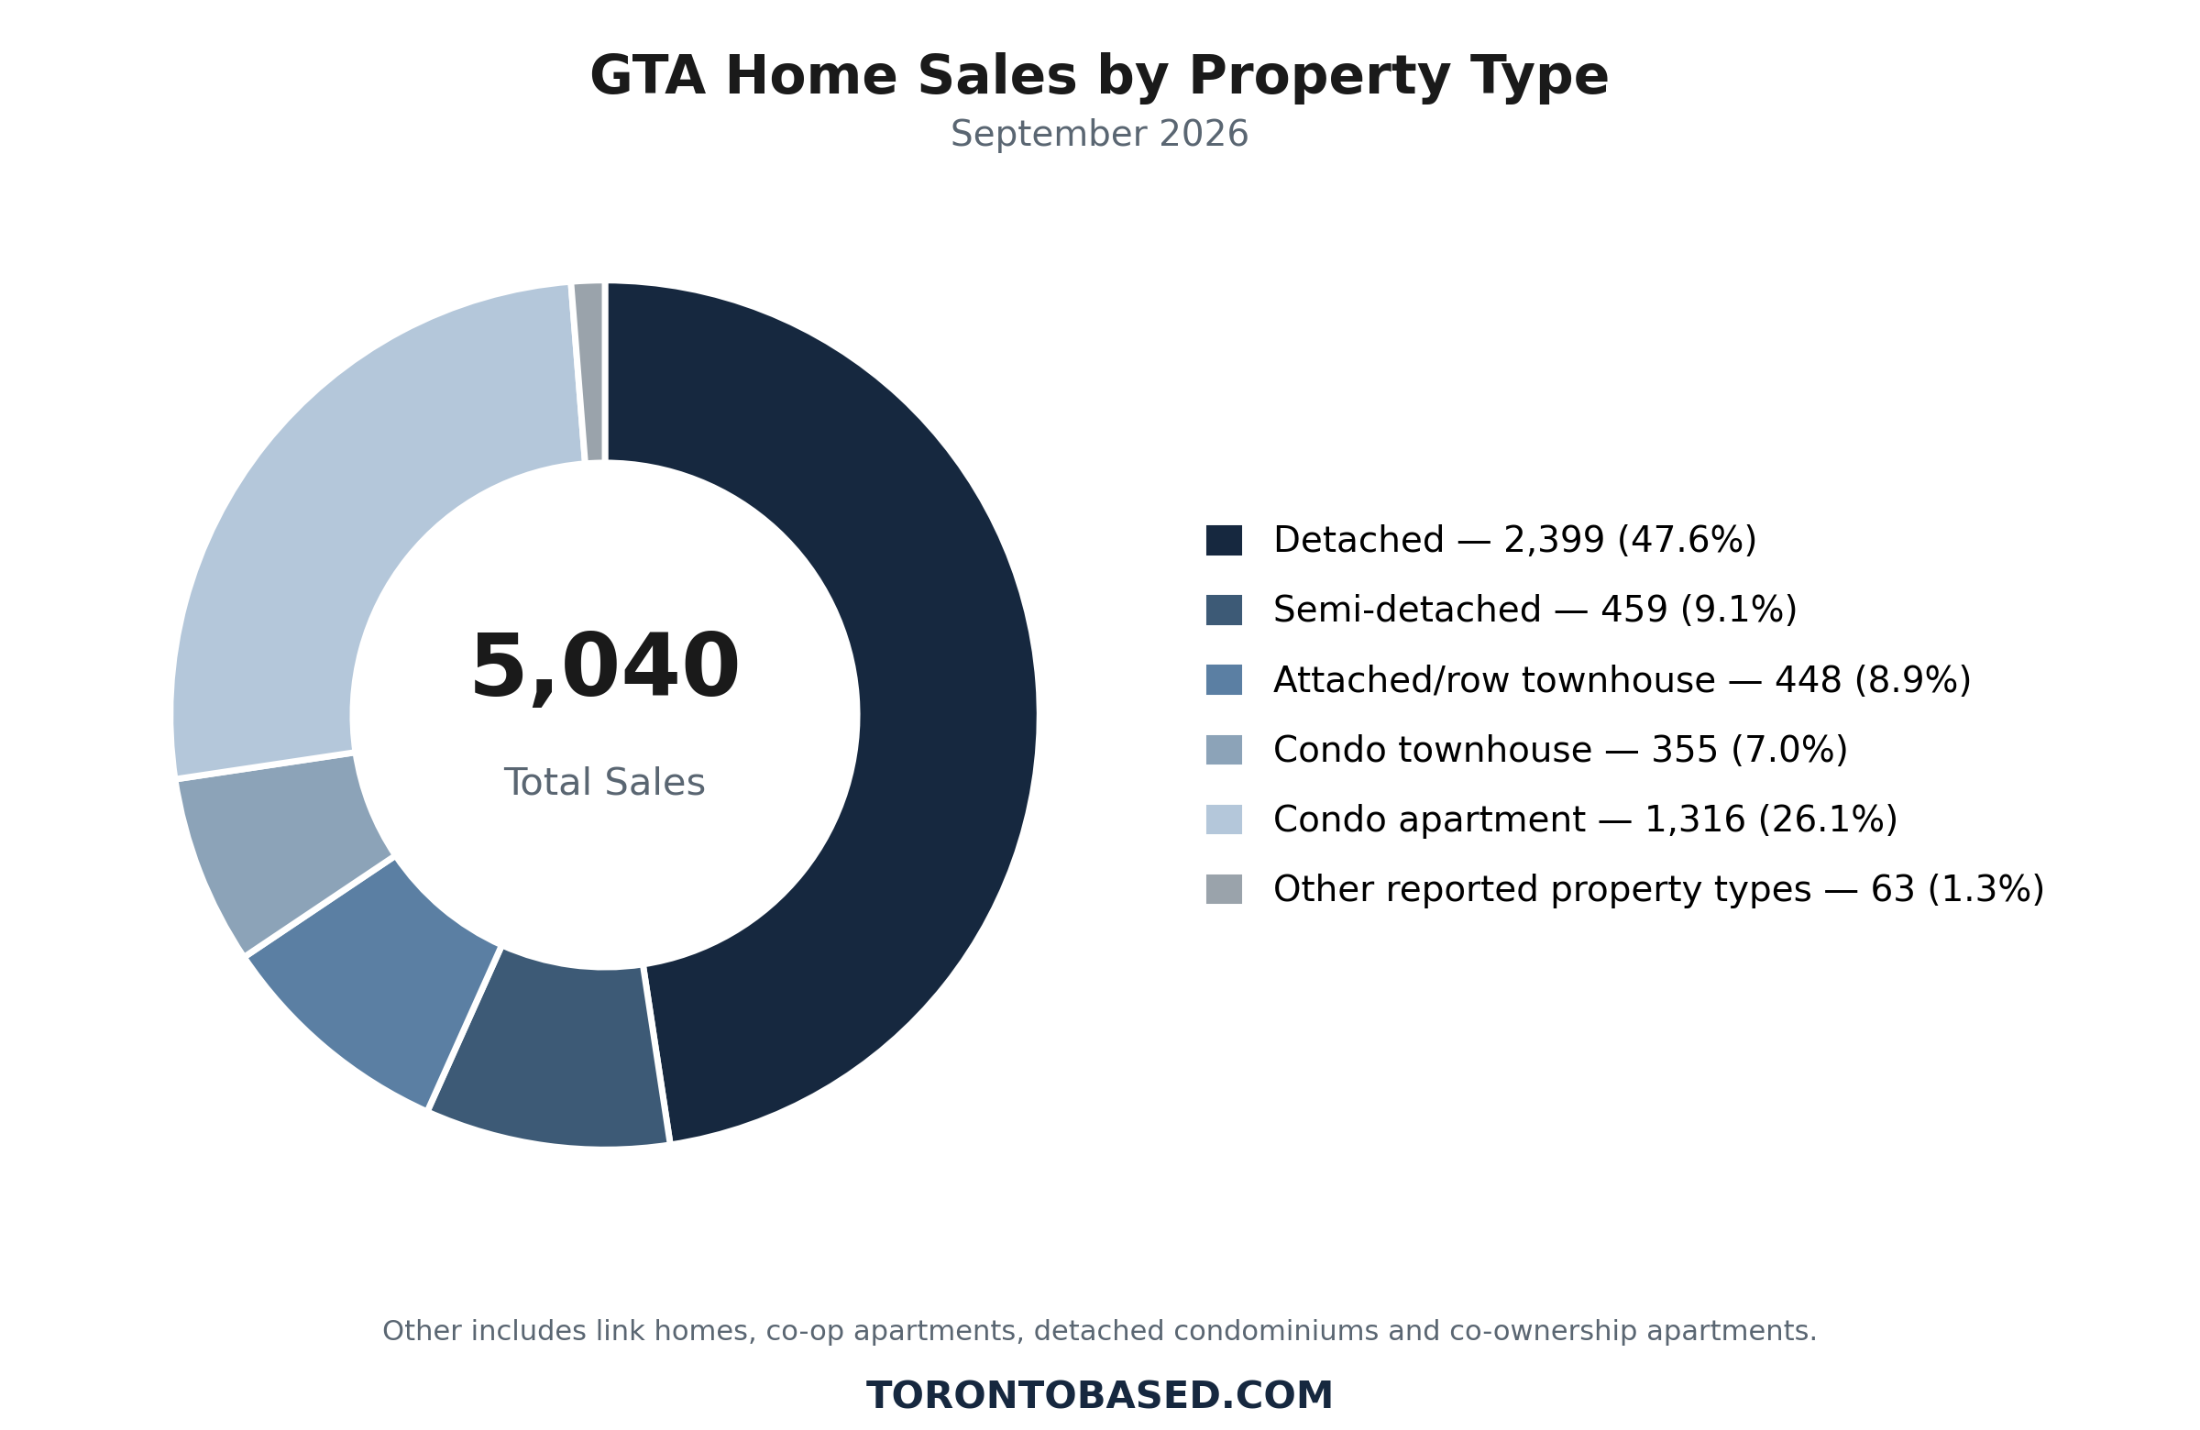
September's sales distribution illustrates these differences.
Source: TRREB Market Watch, September 2026, page 2. Smaller property categories are not included in this five-category presentation.
Detached homes: Still the largest segment
Detached houses accounted for approximately 47.6% of September's reported residential sales.
This reflects the continued importance of detached housing in the GTA resale market.
For many buyers, the attraction includes private outdoor space, greater separation from neighbouring properties, opportunities to accommodate changing family needs and, depending on the property, fewer shared ownership restrictions.
But detached homes also require a substantial financial commitment.
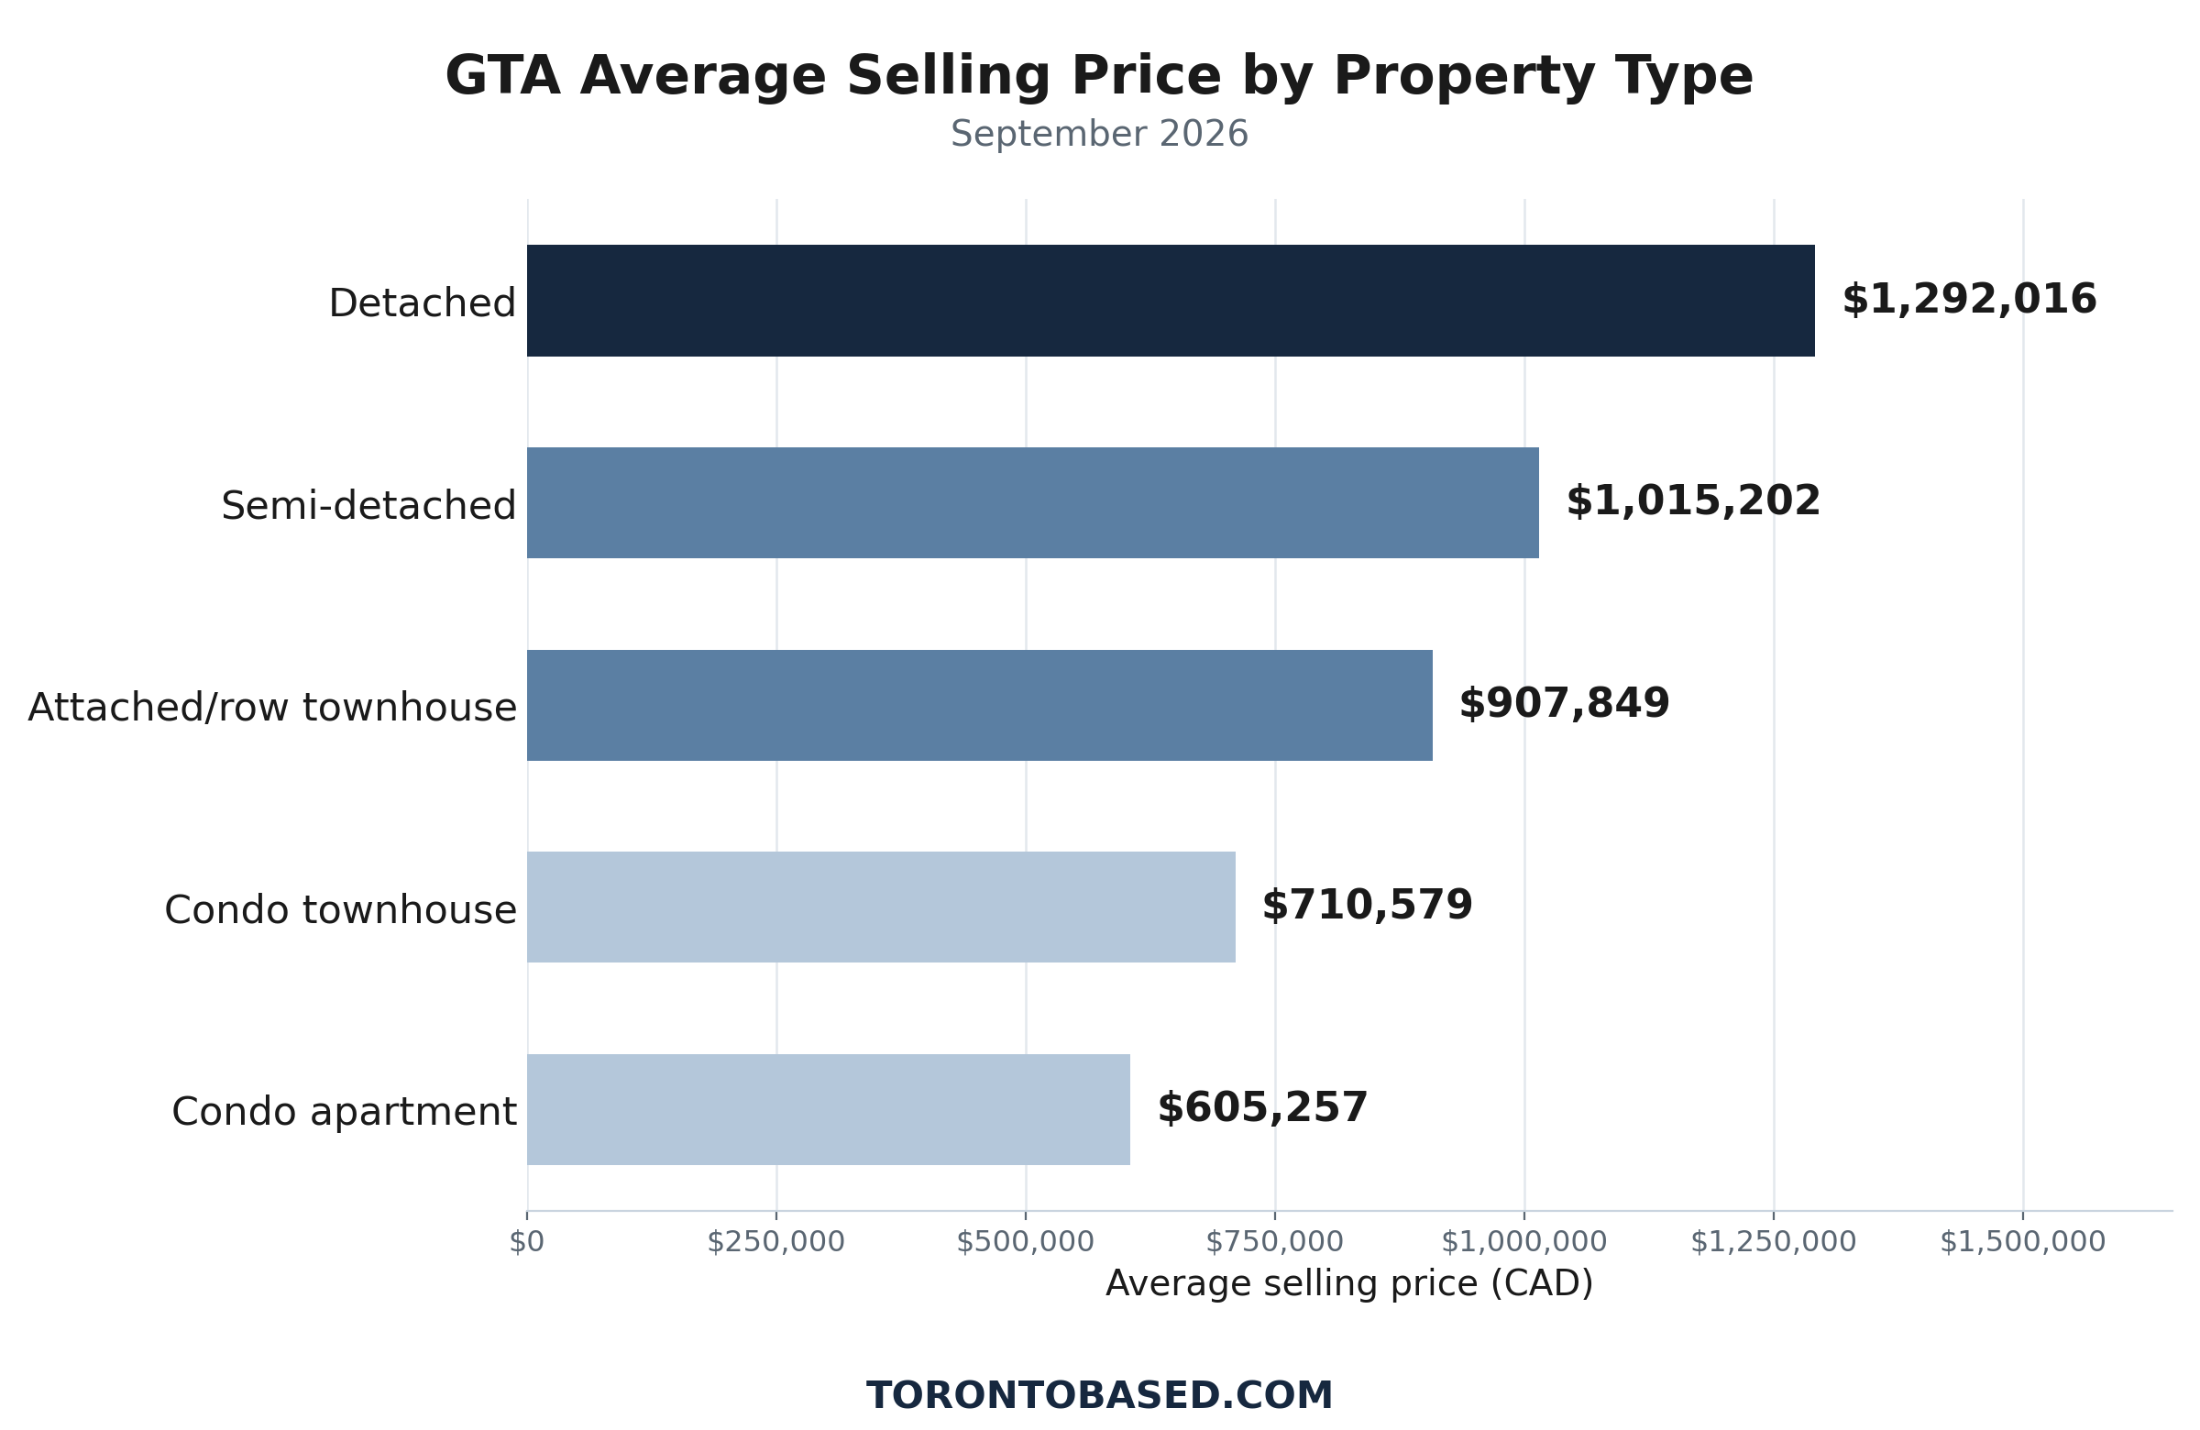
The September average was $1,292,016, well above the condo apartment average.
A lower annual market price does not necessarily make every detached home affordable to households facing mortgage qualification limits, ongoing maintenance expenses and other financial obligations.
For sellers, the lesson is to compare similar detached properties in the same neighbourhood rather than depending on the GTA detached average.
Age, lot size, layout, renovations, basement configuration, parking, condition and street location can all influence value.
Semi-detached homes: A different type of competition
The GTA recorded 459 semi-detached transactions, with an average selling price of $1,015,202.
Semi-detached homes can appeal to buyers seeking freehold ownership without the full financial commitment associated with certain detached properties.
Some neighbourhoods also have a limited supply of well-maintained semis with practical family layouts.
TRREB's major home-type comparison showed that the average semi-detached price was relatively stable compared with September 2025, declining approximately 0.2%.
This is a market-wide annual comparison, not evidence that every semi-detached neighbourhood was stable.
In Toronto East, the regional report recorded an average sale-to-list-price ratio of 108% for semi-detached homes.
That result illustrates how competitive a particular housing segment can remain within a broader market experiencing weaker sales and prices.
Townhouses: Ownership structure matters
Townhouses are especially important for buyers moving between condominium apartments and detached or semi-detached housing.
The September report recorded 448 attached or row townhouse transactions and 355 condominium townhouse transactions.
These are not identical ownership structures.
A freehold townhouse may involve different ongoing costs, maintenance responsibilities and title arrangements from a condominium townhouse.
For condominium townhouse buyers, maintenance fees, reserve funds, common elements and condominium rules require careful review.
The price difference between the two categories should not be used without considering location, size, condition and other property features.
Condominium apartments: A market requiring closer financial analysis
Condominium apartments accounted for approximately 26.1% of GTA residential sales in September.
The average selling price was $605,257, representing a reported annual decline of 7.7%.
The HPI apartment benchmark also declined by 6.67%.
Both indicators point to pricing pressure in the apartment segment.
However, this does not mean every condominium building is equally affected.
Some buildings may have stronger layouts, lower ownership costs, superior maintenance histories or other advantages that distinguish them from competing developments.
Others may face a high concentration of similar units listed at the same time.
Buyers should examine the specific building, maintenance fees, reserve fund information, recent sales, property condition and the unit's suitability.
For condominium sellers, comparable transactions within the building or in truly comparable developments are generally more informative than the city-wide condo average.
For investors, lower purchase prices must be evaluated against achievable rent and ongoing ownership costs.
The opportunity is not simply buying a condominium for less than its previous asking price. It is acquiring a property whose economics and long-term suitability make sense.
Toronto Housing Market: Central, East and West Tell Different Stories
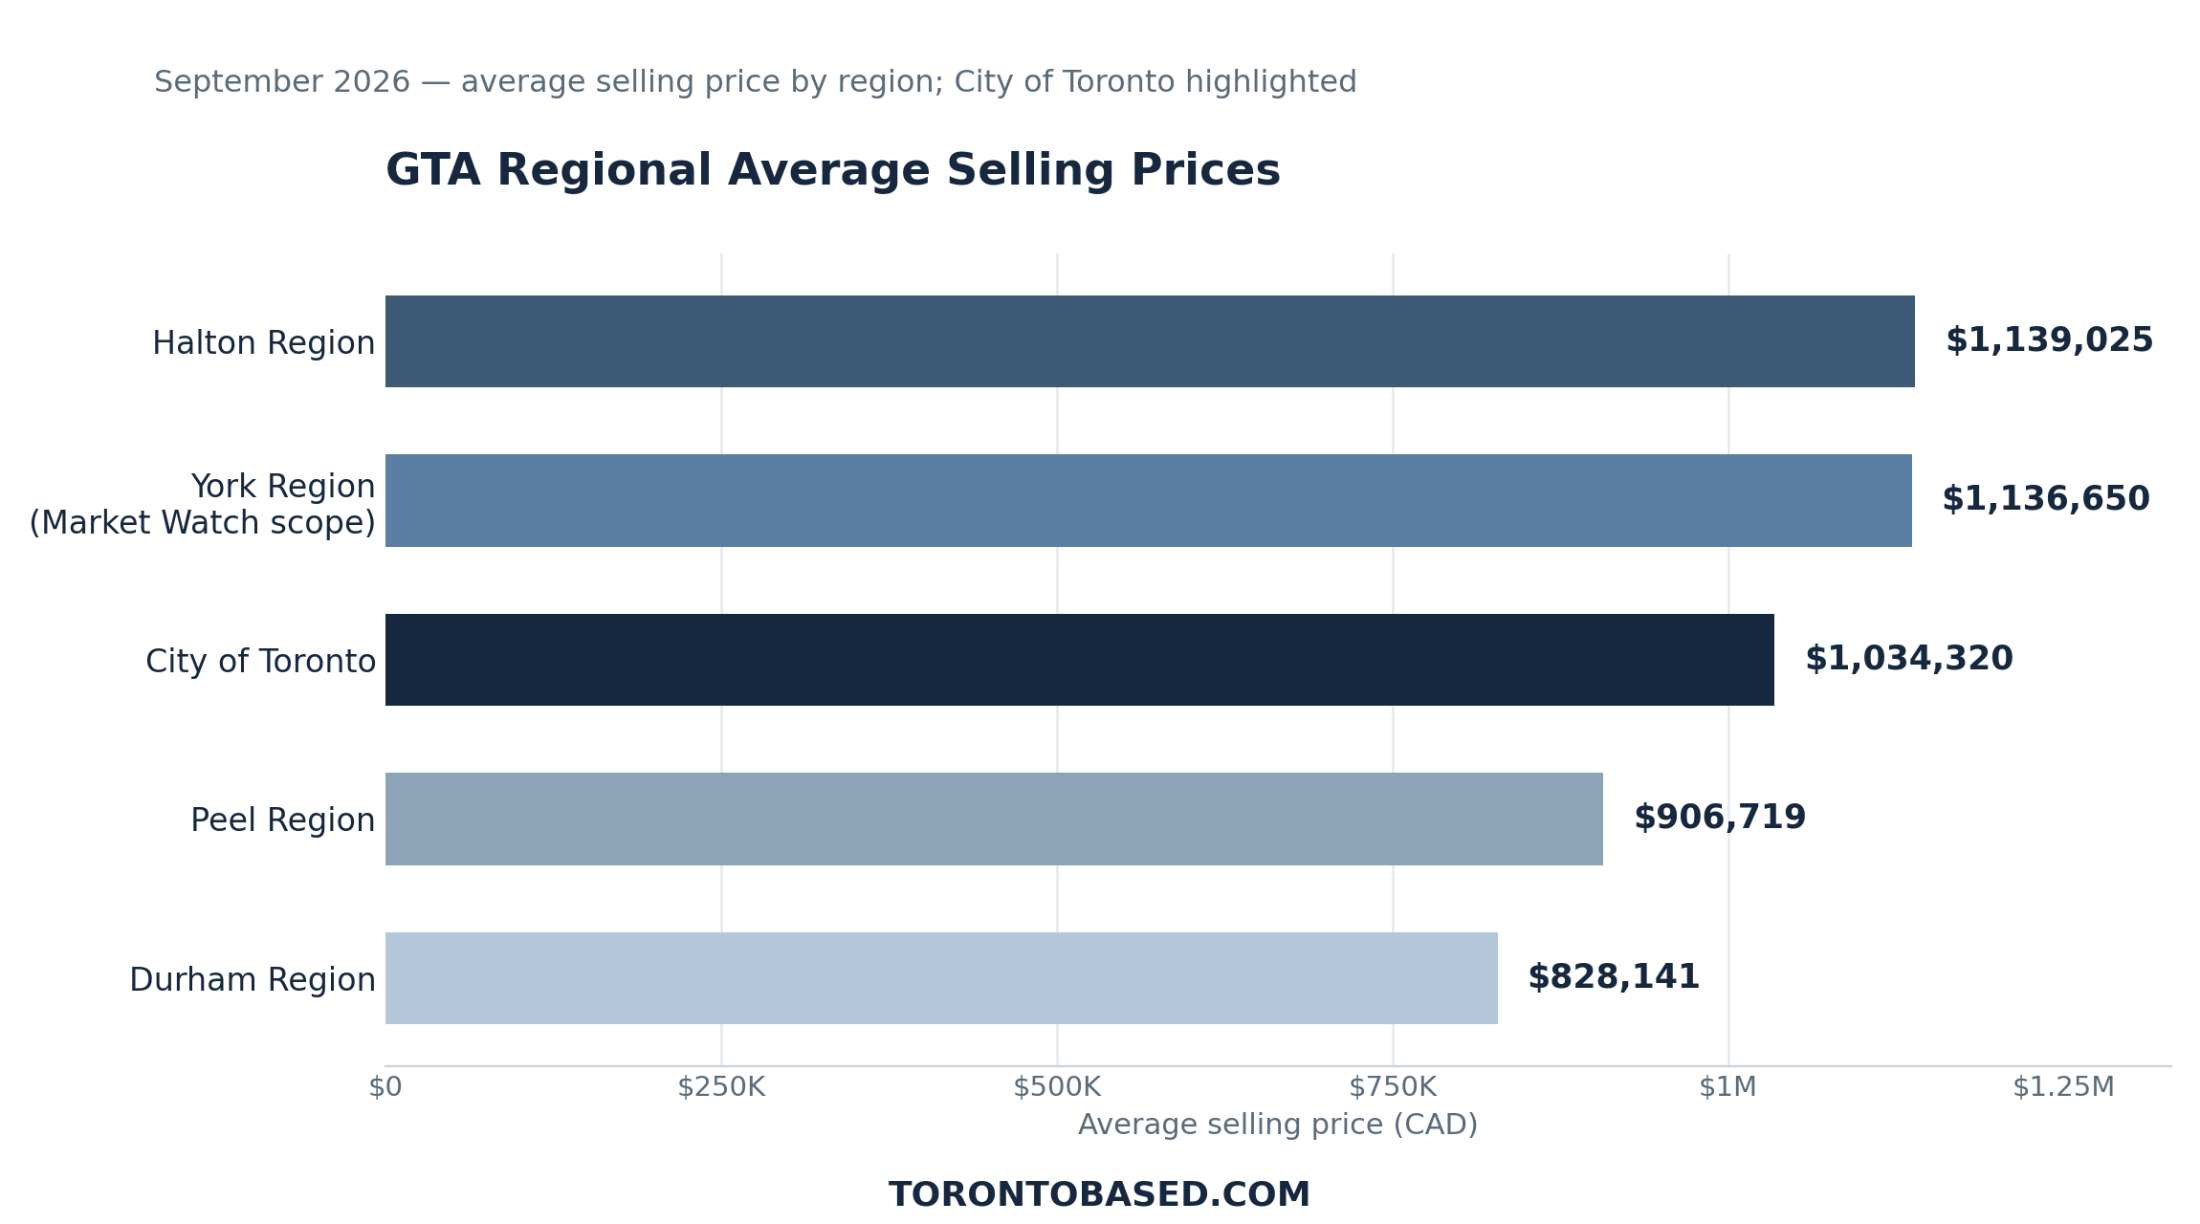
The City of Toronto recorded 1,937 home sales in September 2026, at an average selling price of $1,034,320.
Yet the three major TRREB Toronto reporting districts showed substantial differences.
Sources: TRREB September 2026 Toronto Central, East and West Regional Housing Market Reports, page 2 of each report.
Toronto Central: A diverse market heavily influenced by condominiums
Toronto Central recorded 924 transactions, including 593 condominium apartment sales.
Condominium apartments represented the largest component of the district's transaction activity.
The district also recorded 3,539 active condominium apartment listings at month-end.
That volume of inventory is important for both buyers and sellers.
A seller whose condominium unit competes directly with similar units may need to differentiate it through pricing, presentation, condition or other genuine advantages.
A buyer may be able to compare multiple options within a limited geographic area, but should not assume that every listing has the same financial or physical characteristics.
The average detached home price in Toronto Central reached $2,351,668, demonstrating the enormous difference between the district's detached market and its condominium market.
The district-wide average price therefore combines properties from very different price categories.
Toronto East: Stronger sale-to-list results in selected segments
Toronto East recorded 481 sales, with an average selling price of $956,004.
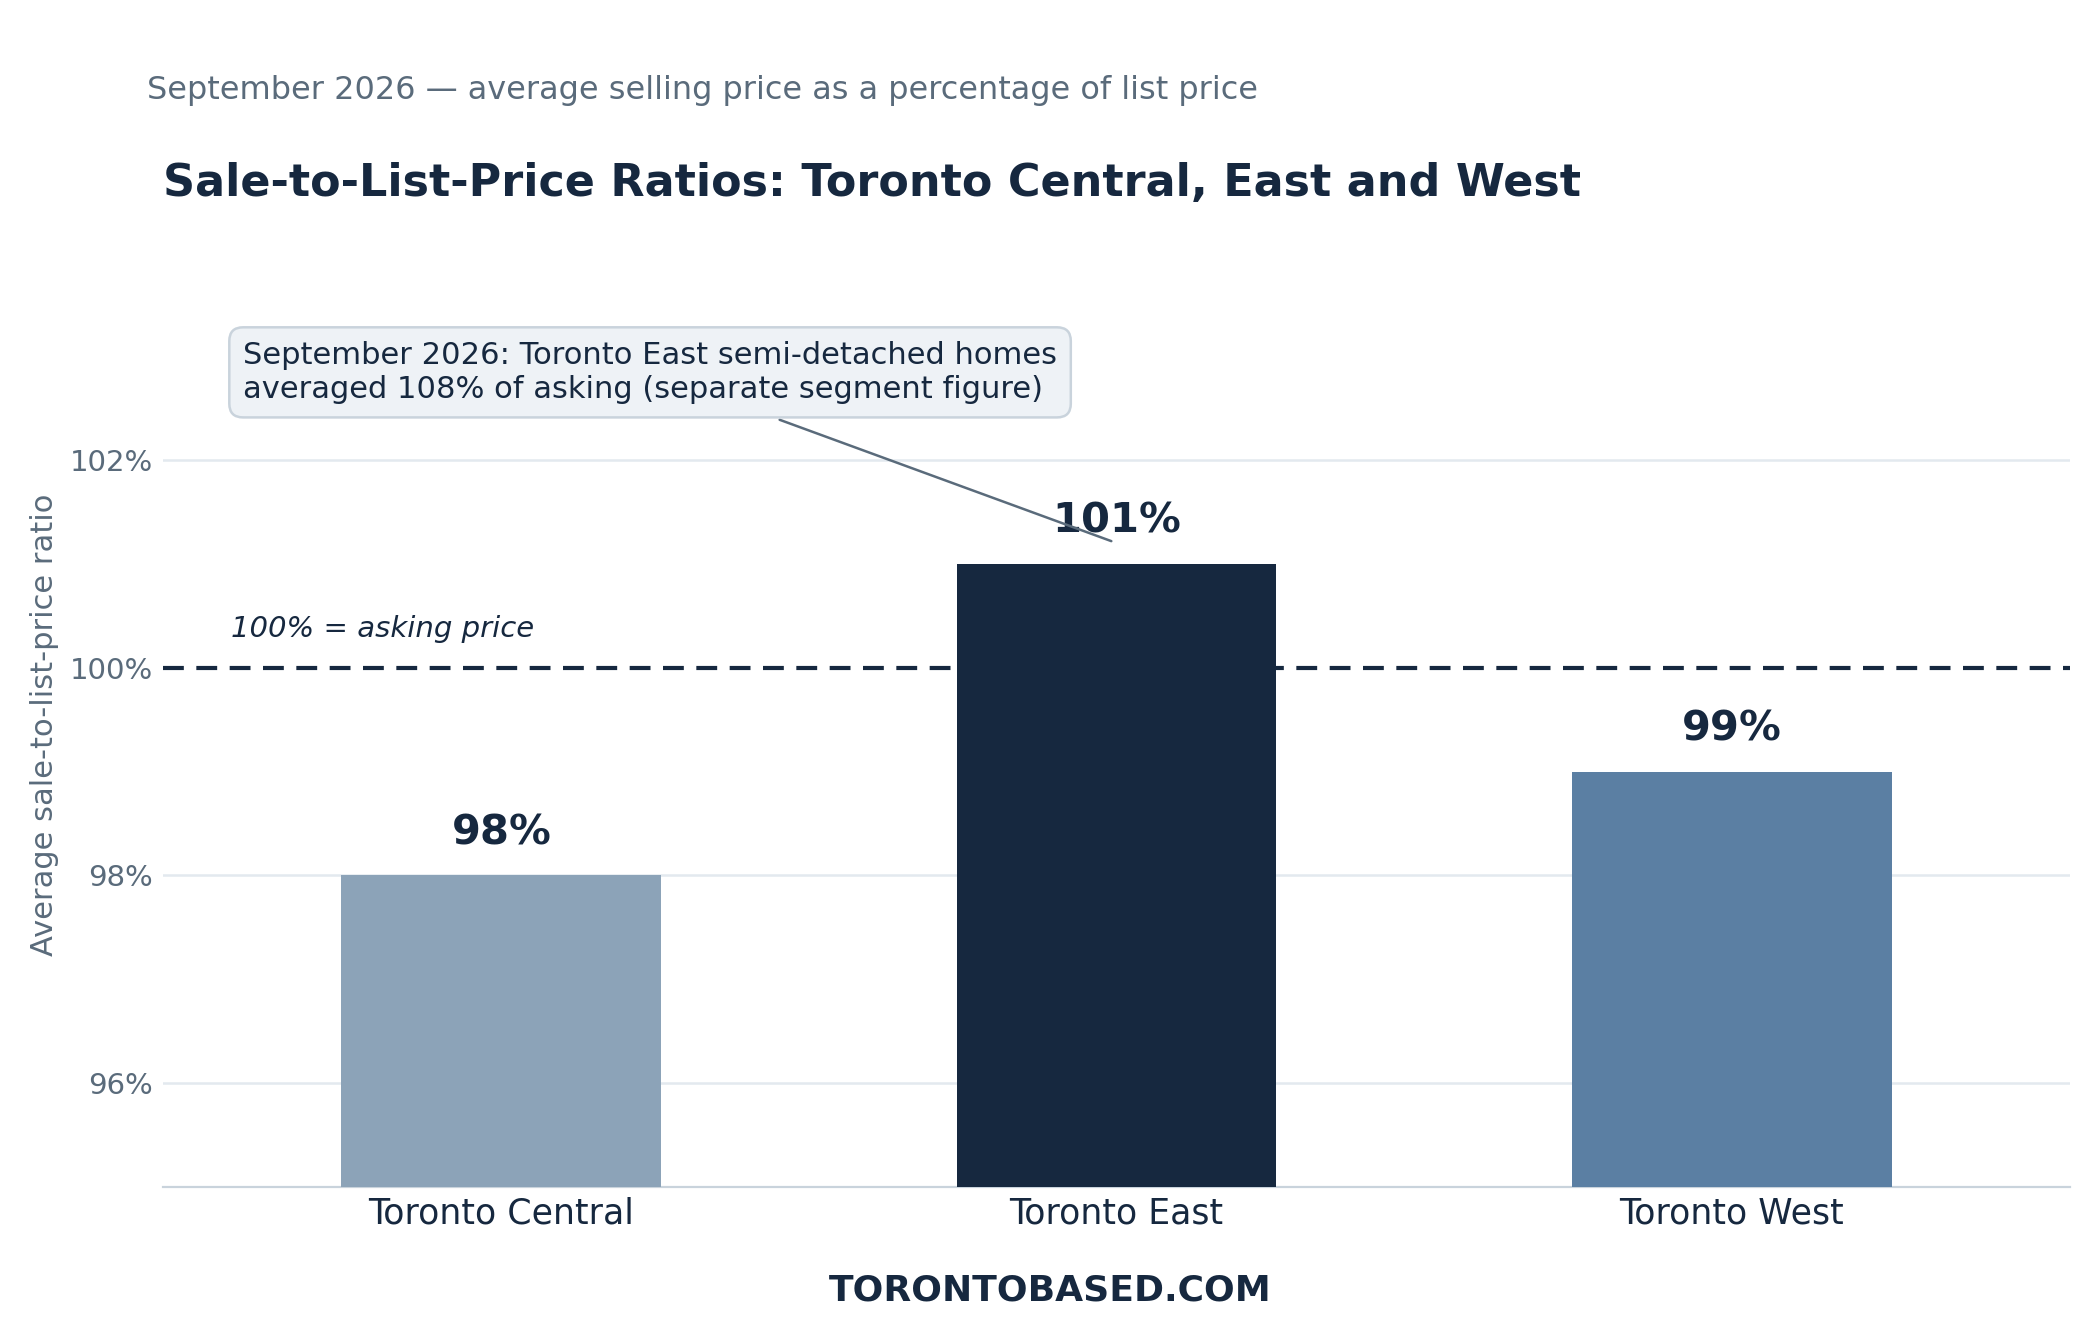
Its average sale-to-list-price ratio was 101%, compared with 98% in Toronto Central.
Semi-detached properties recorded an even higher average ratio of 108%.
In the Toronto E01 reporting area, all property types combined had a 109% average sale-to-list-price ratio, while semi-detached properties recorded 113%.
These figures are particularly significant because they demonstrate that a weaker GTA-wide housing market does not eliminate local competition.
A desirable freehold property may attract multiple interested buyers if the asking price, location and condition align with their expectations.
At the same time, the sale-to-list-price ratio can be affected by the seller's initial asking strategy.
A result above asking is not automatically proof that a property sold above its independently assessed market value.
For homeowners in Scarborough and other Toronto East communities, this reinforces the need to study the actual neighbourhood and property category before making a listing decision.
Toronto West: Different conditions within the same district
Toronto West recorded 532 sales, with an average price of $985,920.
The district-wide sale-to-list-price ratio was 99%.
Its detached segment averaged $1,418,573, while condo apartments averaged $560,272.
The Toronto W02 reporting area recorded a 103% average sale-to-list-price ratio across all home types.
Elsewhere, the level of competition differed.
This demonstrates why even a district-level average can be too broad for an individual real estate decision.
A homeowner in a well-established low-rise neighbourhood should not automatically use condominium activity from another part of Toronto West to assess the property's value.
Likewise, a buyer should not assume the same negotiating opportunities exist in every community.
The more specific the housing comparison, the more useful the market information becomes.
How the Surrounding GTA Regions Performed
For buyers and sellers outside Toronto, the September regional reports show important differences in prices, sales volumes and available inventory.
Peel Region: A broad market with several distinct segments
Peel recorded 936 home sales, with an average selling price of $906,719.
The regional report recorded 2,661 new listings, 4,631 active listings and 35 average listing days on market.
In Brampton, 404 homes sold at an average price of $854,322.
In Mississauga, 468 transactions were recorded at an average price of $929,600.
Caledon recorded 64 sales at an average of $1,070,154.
These differences demonstrate why Peel should not be treated as one uniform housing market.
Mississauga's detached homes averaged $1,285,467, while its condominium apartments averaged $500,192.
The district's condo apartment market also recorded 831 active listings at month-end.
For a Mississauga condo seller, competition from similar units may be a central consideration.
For a detached homeowner, the appropriate pricing analysis should focus on comparable homes rather than condominium statistics.
York Region: Higher prices, but careful buyer selection
The standalone York Regional Housing Market Report recorded 895 sales and an average selling price of $1,134,682.
The region had 5,179 active listings and an average LDOM of 38 days.
Markham recorded 245 sales at an average selling price of $1,125,353.
Vaughan recorded 213 sales at an average selling price of $1,163,441.
In Vaughan, detached homes averaged $1,599,218, while condominium apartments averaged $548,958.
The substantial difference illustrates the importance of identifying the correct property category before comparing prices.
For homeowners in Vaughan, Markham, Richmond Hill and neighbouring York communities, pricing strategy should consider competing properties, buyer purchasing power and the specific features that distinguish each home.
The report's broader York total includes properties outside the narrower York aggregation used in the main Market Watch table. The two geographic definitions should be kept separate when calculating market totals.
Durham Region: Lower average prices and opportunities for comparison
Durham recorded 552 sales at an average selling price of $828,141.
The regional average LDOM was 30 days.
Ajax recorded 77 sales at an average selling price of $828,835.
Pickering recorded 92 sales at an average of $893,842.
Within Pickering, detached homes averaged $1,080,698, compared with $491,143 for condominium apartments.
The numbers demonstrate the range of property options represented within one municipality.
For buyers, Durham may provide a different mix of prices, home types and neighbourhood characteristics compared with parts of Toronto and York.
But affordability cannot be determined from purchase price alone.
Transportation costs, commuting requirements, property taxes, maintenance, financing and household needs should also be considered.
Halton Region: Higher average prices and selective competition
Halton recorded 502 home sales at an average selling price of $1,139,025.
The average detached selling price was $1,428,289.
Burlington recorded 177 sales at an average of $1,033,458.
Oakville recorded 162 sales at an average of $1,365,169.
Oakville detached properties averaged $1,740,421.
The region's high average prices do not establish that every municipality or property type experienced the same market pressure.
For sellers, the gap between asking prices and buyer expectations remains critical.
For buyers, attention should be paid to the long-term suitability and characteristics of the property rather than comparing the regional average alone.
The broader Southern Ontario picture
The uploaded documents also cover surrounding housing markets outside the main GTA reporting geography.
For example, the supplementary reports recorded average selling prices of $768,850 in Simcoe County, $714,875 in Hamilton, $661,937 in Niagara and $703,149 in Waterloo Region.
These markets may offer different property types and price ranges, but they also have distinct local employment conditions, buyer groups and housing supply patterns.
Their statistics should not be added to the GTA total without adjusting for reporting boundaries and possible overlaps.
This broader regional perspective is useful for clients comparing where to live, work or invest. It is not a substitute for detailed neighbourhood research.
Mortgage Rates, Employment and Buyer Confidence
Housing demand depends on more than the asking price of a property.
For many households, the decision to purchase is closely connected to confidence in employment, income stability and borrowing costs.
TRREB's September Market Watch included the following economic indicators:
Bank of Canada overnight rate: 2.3% in the report's September table.
Prime rate: 4.5% in September.
Toronto unemployment rate: 6.8% for August 2026, seasonally adjusted.
Annual CPI inflation: 3.0% for August 2026.
Toronto employment growth: 1.7% year over year for August 2026.
These indicators refer to different reporting periods and should not be interpreted as one uniform September economic measurement.
The Market Watch also included reference mortgage rates, but those should not be treated as personalized mortgage offers or guaranteed financing terms.
Why lower home prices may not immediately increase sales
A household considering homeownership must evaluate several financial commitments.
The purchase price is only the starting point.
Mortgage payments, property taxes, insurance, utilities, maintenance, condominium fees where applicable and other living expenses all affect affordability.
A decline in the selling price may improve one aspect of the calculation, but the buyer may still face uncertainty about employment or future household expenses.
Some buyers may prefer to maintain financial flexibility rather than commit immediately.
Others may qualify for a mortgage but remain unwilling to purchase a property that does not meet their needs.
This helps explain why lower prices do not necessarily lead to an immediate increase in sales.
The importance of financial readiness
For buyers, obtaining mortgage preapproval and understanding their comfortable monthly budget should come before deciding how much to offer.
For sellers, understanding current buyer financing constraints can help establish realistic expectations.
A property priced beyond the financial reach of its likely buyer group may experience limited demand regardless of presentation.
The objective should be to connect the property with qualified buyers who recognize its value and can complete a transaction.
The Psychology of Today's GTA Homebuyers and Sellers
Real estate markets are influenced by financial conditions, but expectations and behaviour also matter.
When home prices have been declining, some buyers may become concerned that purchasing today could expose them to further price reductions.
This can encourage delayed decisions, repeated comparisons and more conservative offers.
Sellers may respond differently.
Homeowners who remember higher property values may continue to anchor their expectations to earlier market conditions.
That difference between buyer expectations and seller expectations can make negotiations more difficult.
Why a good property may still fail to sell
Consider two broadly comparable homes within the same neighbourhood.
One has a realistic asking price, strong photography, clear property information and condition consistent with buyer expectations.
The other is priced substantially above comparable recent sales and requires improvements that are not reflected in its asking price.
Even without a shortage of interested buyers, the first property may generate stronger responses.
The second may remain available until the asking price or market circumstances change.
This is an illustrative scenario rather than a measurement of individual September transactions.
The important lesson is that buyers are comparing relative value, not simply deciding whether they like a property.
The danger of chasing yesterday's market
Some homeowners may base their expectations on prices achieved during a stronger period.
Historical sale prices remain useful context, but they cannot replace current evidence.
A successful asking strategy should reflect the most comparable recent sales, competing listings and present buyer behaviour.
Likewise, buyers should not assume that a home is overpriced merely because it would have sold for more in an earlier market.
The correct question is whether the current price is supported by current comparable evidence.
Seller Strategy: How to Position a Home in the September Market
For homeowners planning to sell, the September market requires a disciplined approach.
The central challenge is attracting qualified buyers while protecting the property's value.
Start with a current comparative market analysis
A comparative market analysis should identify recently sold properties that resemble the subject home.
The most relevant comparisons ordinarily share characteristics such as location, property type, approximate size, condition, layout and other material features.
Active listings provide information about current competition.
Expired, terminated or repeatedly relisted properties can reveal prices that buyers may not have accepted.
But every comparison needs context.
A renovated detached home should not automatically be compared with a substantially smaller property requiring extensive repairs.
Similarly, a freehold townhouse should not be treated as equivalent to a condominium townhouse simply because both have a similar exterior appearance.
Establish a defensible asking strategy
Different asking strategies may be appropriate in different markets.
A seller may use a price intended to attract a broad audience or pursue a more direct asking strategy supported by recent sales.
Neither approach guarantees multiple offers or a successful result.
A delayed-offer strategy may work where there is convincing evidence of concentrated buyer demand.
It may be less effective where inventory is high and buyers have numerous similar alternatives.
The strategy should be chosen after reviewing the local competition, not merely because it worked for another property.
Prepare the property for serious buyers
Presentation is especially important when buyers have options.
Professional photography, accurate floor plans, clean and well-maintained interiors, appropriate lighting, clear descriptions and accessible showing arrangements all help communicate value.
These elements do not change the fundamental characteristics of the property.
They help buyers understand those characteristics more effectively.
Where repairs or deficiencies exist, sellers should assess them before listing and make appropriate disclosures.
Concealing problems is not a marketing strategy.
Monitor the response after launch
The first stage of a listing campaign can provide useful feedback.
Relevant indicators include showing requests, buyer questions, open house conversations, follow-up inquiries, second showings and written offers.
But traffic alone does not determine success.
A large number of casual viewers may be less valuable than serious engagement from qualified buyers.
If a listing receives limited meaningful response, the seller and brokerage should review price, presentation, exposure and competing inventory rather than relying only on more advertising.
Protect the transaction
An attractive offer is not necessarily the strongest offer if the buyer's ability to complete the purchase is uncertain.
Sellers should consider price alongside financing, deposit arrangements, conditions, closing date and other terms.
Legal advice should be obtained where appropriate.
The strongest selling strategy balances market exposure, realistic pricing and careful transaction management.
In September's market, preparation and pricing are not optional finishing touches. They are central parts of the selling strategy.
Buyer Strategy: How to Find Real Value Without Taking Unnecessary Risks
For prospective buyers, the current environment presents opportunities to make informed decisions.
But the goal should not simply be to obtain the largest possible discount.
It should be to purchase the right property under suitable financial and contractual conditions.
Understand the market before viewing properties
A buyer should begin with an appropriate search area, preferred property type, budget and essential requirements.
The search should distinguish between features that are necessary and those that would merely be desirable.
A family may prioritize bedrooms, layout, schools or commuting requirements.
Another household may place greater importance on accessibility, transit or lower maintenance responsibilities.
Understanding those priorities makes comparisons more effective.
Review sold properties, not just asking prices
An asking price is an invitation to negotiate. It is not automatically market value.
Buyers should compare recent sold properties, condition, upgrades, floor plans, location and listing history.
An overpriced listing may appear attractive after a price reduction, but the reduction itself does not prove that the current asking price is fair.
Similarly, a property listed below comparable sales may attract competition rather than providing an easy opportunity to purchase at a bargain price.
Use conditions and due diligence appropriately
Buyers should understand the implications of financing conditions, inspections, status certificate review where applicable and other contractual protections.
The appropriate conditions depend on the property and transaction.
A condominium buyer may need to examine maintenance fees, reserve fund information, condominium rules and other documents.
A buyer considering a freehold property should assess physical condition, financing and any material legal or property concerns.
The desire to win a negotiation should not replace prudent due diligence.
Know when to negotiate and when to act
Some properties may have limited competition and extended marketing exposure.
Those conditions may provide room for negotiation.
Other properties, particularly well-priced homes with desirable features, may attract faster decisions.
A buyer who assumes every seller is desperate could lose an appropriate property.
Conversely, a buyer who rushes without reviewing comparables could overpay or accept unsuitable terms.
A balanced purchasing strategy uses evidence, financial readiness and a clear understanding of personal requirements.
Consider long-term suitability
No one can identify the exact market bottom with certainty from the September data.
Buyers should therefore focus on whether the home meets their needs, whether the price is reasonable and whether ownership is financially sustainable.
A property that works for a household over a meaningful ownership period may be more valuable to that household than an attempted short-term prediction about price movements.
Investor Outlook: Lower Prices Do Not Automatically Mean Better Returns
Real estate investors face a different set of decisions from buyers purchasing a primary residence.
An investor must evaluate the property's ability to generate income, the cost of financing, ongoing expenses and potential risks.
September's lower condominium prices may attract investor interest, but purchase price alone does not determine whether an investment makes sense.
What the supplied rental data reveals
The latest rental report included in this dataset covers the second quarter of 2026.
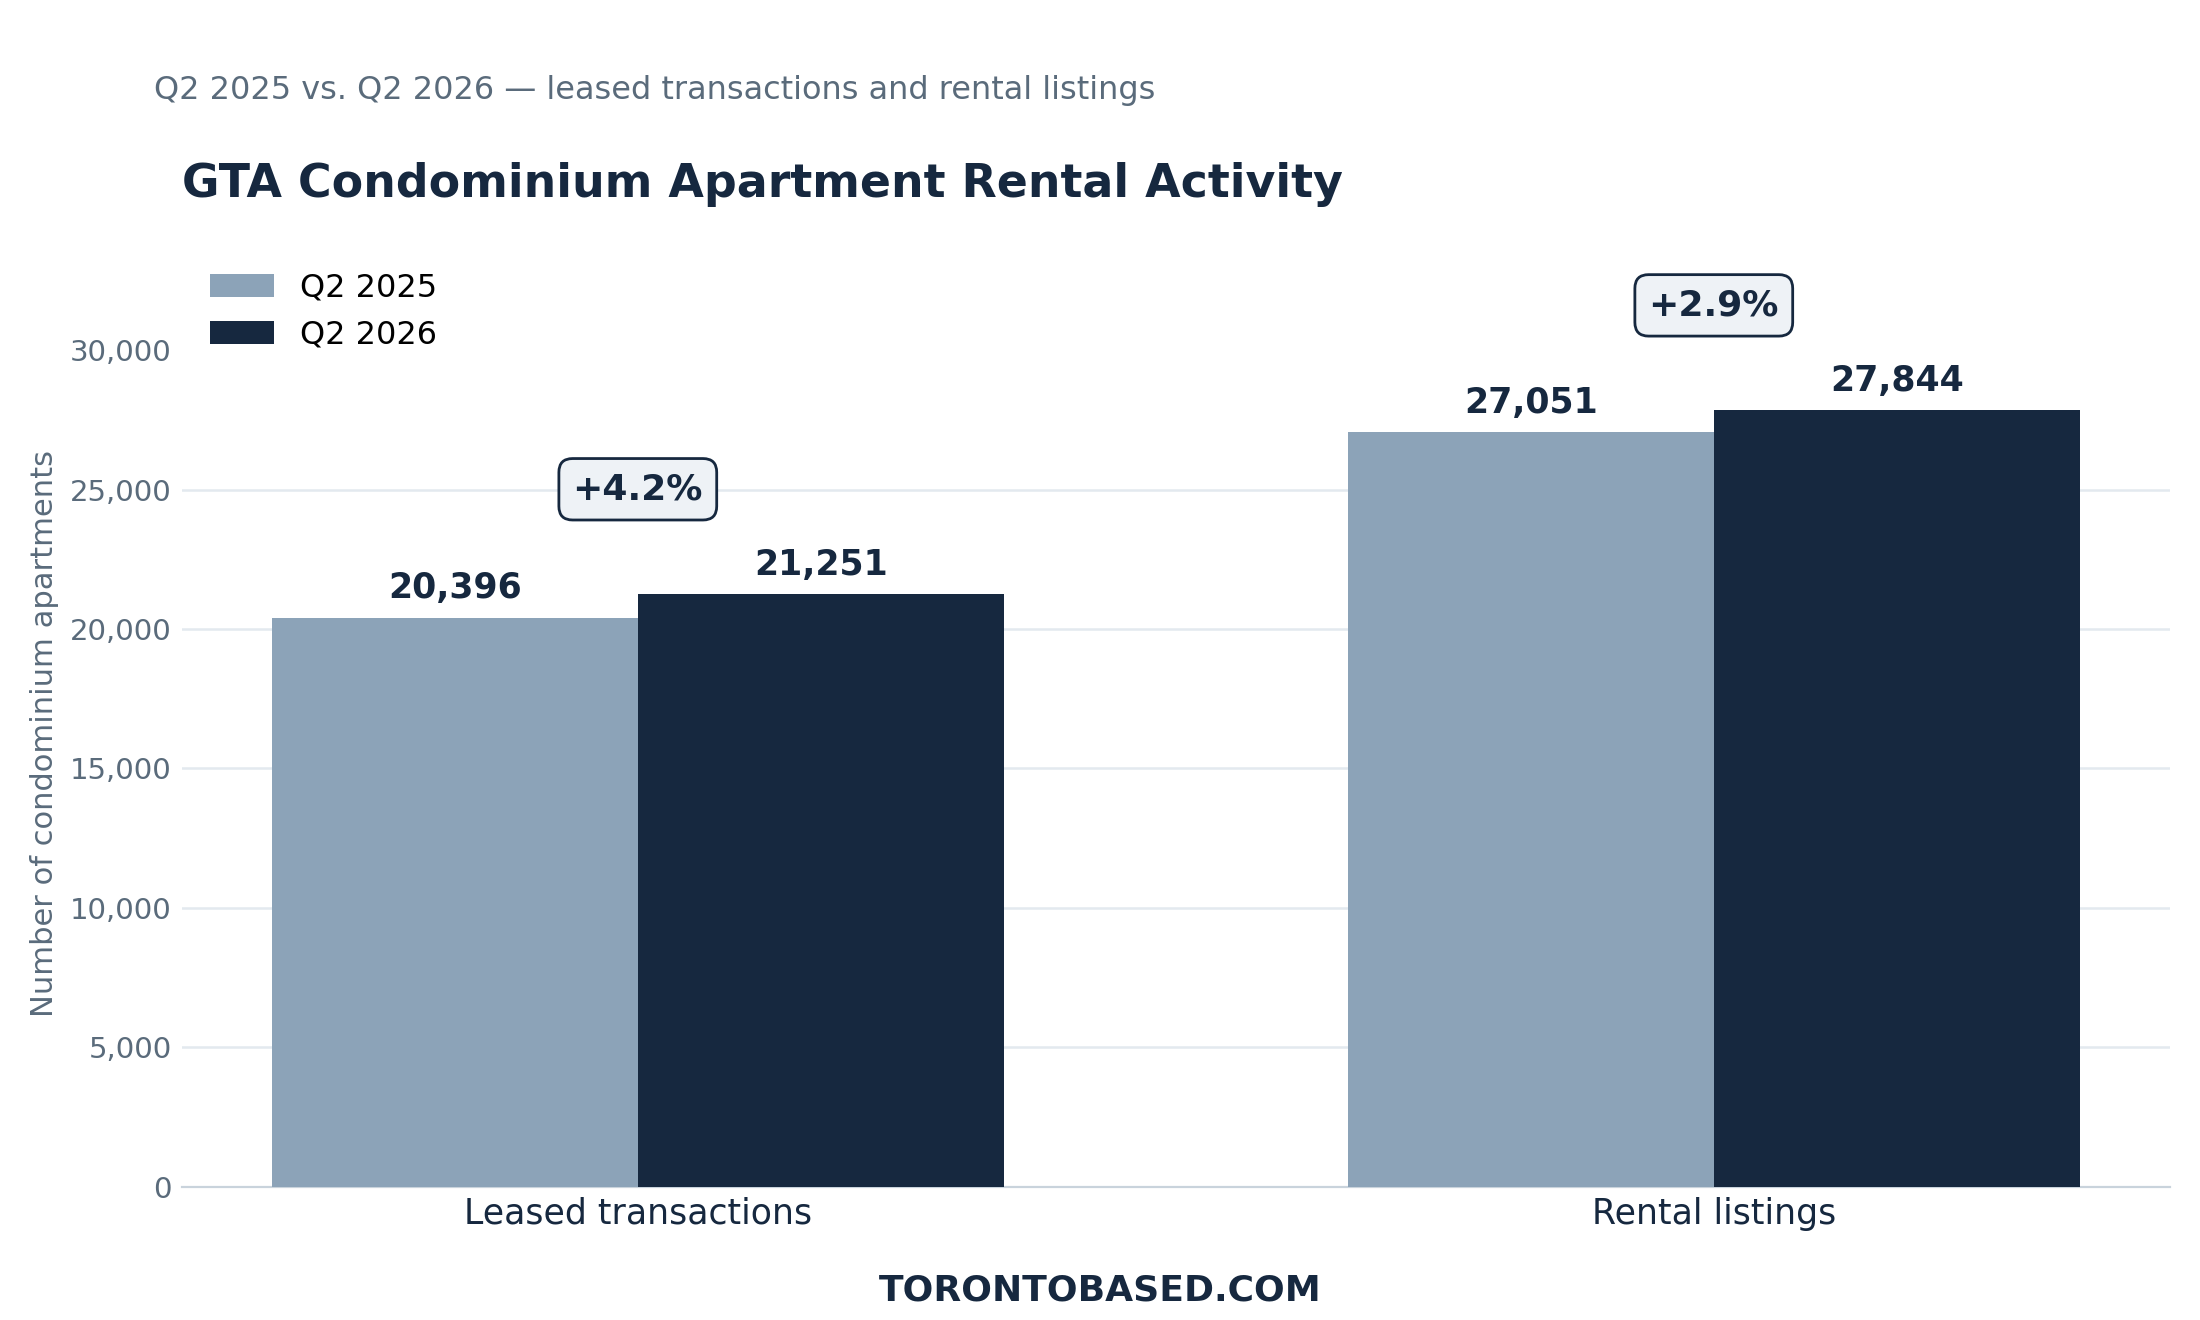
According to TRREB, condominium apartment rental transactions totalled 21,251 during Q2 2026, an increase of 4.2% from the previous year.
The number of condominium apartment units listed for rent rose 2.9% to 27,844.
Average one-bedroom rent declined 2.3% year over year to $2,273, while average two-bedroom rent declined 1.7% to $3,013.
These figures indicate that rental transaction activity increased during the quarter even while average rents remained below the previous year's levels.
They do not establish September rental performance.
Why acquisition price is only part of the equation
An investor considering a condominium purchase must evaluate more than the asking price.
The analysis should include realistic rental income, mortgage costs, property taxes, condominium maintenance fees, insurance, repairs, vacancy allowances and potential future capital expenses.
Local rental demand, tenant requirements, building condition and applicable rental regulations also matter.
A unit purchased at a lower price may still produce weak cash flow if the financing and operating costs are too high.
Similarly, an attractive rental property may require significant capital investment before it becomes suitable for tenants.
Evaluate investment risk before anticipated appreciation
Investors should distinguish between current income and potential future price appreciation.
The September dataset shows that resale prices remained under pressure.
It does not identify a confirmed market bottom or guarantee future gains.
An investment that depends entirely on rapid appreciation may be exposed to substantial uncertainty.
A more disciplined approach considers whether the investment remains financially manageable under different rent, expense and vacancy outcomes.
For investors purchasing with borrowed funds, cash reserves and financing resilience deserve particular attention.
Risk Scenarios: What Could Go Wrong for Buyers, Sellers and Investors?
September's market conditions create opportunities, but also several risks.
Scenario A: Prices remain under pressure
If buyer confidence remains weak and transaction activity fails to improve, sellers could face continuing price sensitivity.
Buyers who purchase without sufficient financial flexibility may find short-term changes in market value uncomfortable, particularly if they need to resell sooner than expected.
Investors relying on near-term appreciation could also face difficulty.
Scenario B: Listings decline faster than demand
If fewer owners list properties while buyer participation improves, the available selection could tighten.
This may create renewed competition in some neighbourhoods before the market-wide statistics show a broad recovery.
Buyers waiting indefinitely for lower prices could discover that suitable properties have become harder to find.
However, the September data alone cannot establish when or whether this will happen.
Scenario C: Different housing segments move in different directions
Detached homes, townhouses and condo apartments may respond differently to changes in financing costs, demand and supply.
A stronger freehold segment does not guarantee a condominium recovery.
Likewise, a weak condo market does not prove that all detached housing will decline at the same rate.
Investors and homeowners should avoid applying broad forecasts indiscriminately.
Scenario D: Economic uncertainty continues
If households remain concerned about income stability, borrowing costs or general economic conditions, buyer confidence may remain constrained.
This can influence not only whether a buyer purchases, but also how much financial risk the household is prepared to accept.
A lower home price may be insufficient to overcome those concerns.
Scenario E: Sellers and buyers misread the market
A seller may assume that limited inventory guarantees a premium selling price.
A buyer may assume that declining averages justify a large reduction on every property.
Both assumptions can lead to poor decisions.
The strongest approach is to evaluate the specific property using recent, relevant and verifiable market evidence.
What Comes Next for the GTA Housing Market?
September 2026 does not provide definitive evidence that the GTA housing market has reached its lowest point.
It also does not support the conclusion that a broad recovery is already underway.
The report instead reveals a market still adjusting to buyer caution, affordability concerns and changing supply conditions.
Several indicators deserve attention in the coming months.
Sales activity
A sustained increase in completed transactions would indicate that more buyers were prepared to act.
However, a single monthly increase should be considered alongside seasonal patterns and year-over-year comparisons.
New and active listings
If sales improve while new listings and active supply remain constrained, the relationship between buyers and available properties could change.
If inventory expands faster than demand, sellers may continue to face substantial competition.
MLS® HPI and average selling prices
Both measures should be monitored.
An increase in the transaction average alone would not confirm that comparable home values are rising.
A more convincing improvement would involve stabilization across relevant price measures and property categories.
Marketing times
Changes in LDOM and PDOM may help indicate whether homes are attracting buyers more quickly or remaining available longer.
However, differences by housing type and neighbourhood remain essential.
Consumer confidence
Employment stability, borrowing conditions and household financial expectations will continue to influence purchasing decisions.
The September Market Watch identified economic and affordability uncertainty as important concerns affecting the housing market.
How those concerns evolve will help shape demand.
The responsible outlook is therefore conditional.
The market may stabilize if buyer confidence improves and supply remains manageable. It may continue to experience pricing pressure if demand remains weak. Different segments may follow different paths.
What cannot be justified from September alone is a precise prediction of the timing or size of the next major price movement.
The Bigger Lesson: The GTA Is Not One Housing Market
The September 2026 data illustrates a reality that becomes especially important during periods of market adjustment.
The Greater Toronto Area contains many distinct housing markets.
A Toronto East semi-detached home may face a different competitive environment from a downtown condominium apartment.
A detached home in Oakville may attract a different buyer group from a townhouse in Pickering.
A property in Vaughan may compete with a different range of alternatives from a similar-looking property in Mississauga.
Even within the same neighbourhood, condition, layout, lot characteristics and asking strategy can create different outcomes.
This is why homeowners should be cautious when relying on generalized headlines.
The GTA average selling price is useful for understanding the direction of the wider market, but it is not an appraisal of an individual property.
The MLS® HPI is useful for tracking broader price changes, but it does not eliminate the need for local comparable sales.
Days-on-market statistics reveal how the market has behaved, but they cannot guarantee how quickly a particular listing will sell.
And declining prices may create potential opportunities for buyers and investors, but they do not replace financial planning.
The central message from September 2026 is straightforward: Prices and sales declined, inventory tightened, and local market strategy became more important than broad market assumptions.
For sellers, that means realistic pricing, effective preparation and careful offer evaluation.
For buyers, it means examining comparable sales, understanding financing and making decisions based on long-term suitability.
For investors, it means concentrating on achievable income, expenses, risk and financial resilience.
The people best positioned to navigate this market are not necessarily those who predict the next price movement correctly.
They are those who understand their own objectives and make decisions supported by accurate, relevant market information.
Data Sources and Methodology
This analysis uses the September 2026 dataset supplied from the Toronto Regional Real Estate Board and PropTx, including:
TRREB Market Watch, September 2026, published October 6, 2026, including pages 1–3 and the MLS® HPI tables.
TRREB MLS® HPI Benchmark Summary Report, September 2026.
TRREB Housing Market Charts, September 2026.
TRREB Regional Housing Market Reports for Toronto Central, Toronto East, Toronto West, Durham, Halton, Peel and York, together with the broader Southern Ontario regional reporting collection.
TRREB Rental Market Report, Q2 2026, used only as earlier rental market context.
PropTx Market Stats Quick Overview and Days on Market reference material.
All cited housing and rental figures originate from the supplied dataset. Year-over-year and month-over-month comparisons retain their stated reporting periods.
Data interpretation notice: The GTA Market Watch total and certain standalone regional report totals use different geographic coverage. Average prices, median prices and HPI benchmarks are distinct measures. Market conditions vary by neighbourhood and property type. Commentary about potential buyer or seller behaviour is interpretation, not direct measurement of individual intentions. Forecast scenarios are conditional and are not predictions of guaranteed outcomes.
Thinking About Buying, Selling or Investing in the GTA?
The September 2026 housing market has created a different set of challenges and opportunities for buyers, sellers and investors.
If you own a home, the important question is not simply how much GTA prices have declined. It is how your specific property compares with recently sold homes and competing listings in your neighbourhood.
If you are buying, the important question is whether the property offers good value and fits comfortably within your financial plans.
If you are investing, the decision should begin with a careful examination of acquisition costs, achievable rental income and long-term investment risk.
Request your September 2026 Neighbourhood Market Review.
I can help you understand recent comparable sales, competing properties, local market conditions and the opportunities or challenges that may affect your next real estate decision.
Whether you are planning to sell, looking for your next home or exploring an investment, informed decisions begin with reliable local market data.
Sami Chowdhury
Real Estate Broker | RE/MAX Realtron Realty Inc., Brokerage
Website: https://torontobased.com
Email: samichy@torontobase.com
Mobile: 416-219-7046
Your property. Your neighbourhood. Your strategy.
Latest Market Insights (Updated Monthly)
Toronto & GTA Housing Market — Aug 2026
Rent vs Own in Toronto (2026): What Happens After 25 Years?
Renting vs. Owning: How $2,500/month could cost you $190,000
GTA Housing —GTA Buyer Guide 2026
GTA Housing Market — Nov 2025
Mississauga Condo Market — Q3 2025
Durham Region Market Report — Oct 2025
Bill 60 vs Ontario RTA — What’s Changing?
Read more market reports & analysis →