RSS

🌫️ Harvesting Water from the Air: How Fog Nets in Peru Are Turning Mist into Life

Introduction: From Fog to Fresh Water

High in the arid hills above Lima and Arequipa, Peru, a quiet revolution is underway. Where rainfall is scarce and rivers are distant, engineers and villagers are working together to harvest water directly from the air. Their tool isn’t a machine or a pipe — it’s a net.

These vertical fog-catching systems, often several meters tall, stand like sentinels in the mist. The nets, sometimes coated with biomimetic materials such as cactus fiber, capture microscopic droplets from the air. The moisture condenses, drips into gutters, and is stored in tanks for drinking, irrigation, and livestock.

Each installation can collect 300–400 liters per day, and when scaled across dozens of nets, these systems can support entire communities. What began as a grassroots idea is now inspiring countries from Morocco and Chile to Namibia and India — all searching for new ways to survive water scarcity.


1. The Global Water Crisis — and Why Fog Matters

Water scarcity affects more than 2 billion people globally. Many live in regions that receive less than 250 mm of rain per year — technically deserts — yet remain rich in fog and humidity.
Peru’s Pacific coast is a textbook example: it’s one of the driest deserts in the world, but dense coastal fog, known locally as “garúa,” forms almost daily from May to November.

Traditional water systems fail here. Wells hit salty groundwater; rainfall is rare; and water trucks are expensive. For years, Lima’s poorest residents paid up to ten times more per liter for trucked water than wealthier neighborhoods with city connections.

So locals began to ask: if fog wets your clothes and coats the hills in dew, could it fill your buckets too?


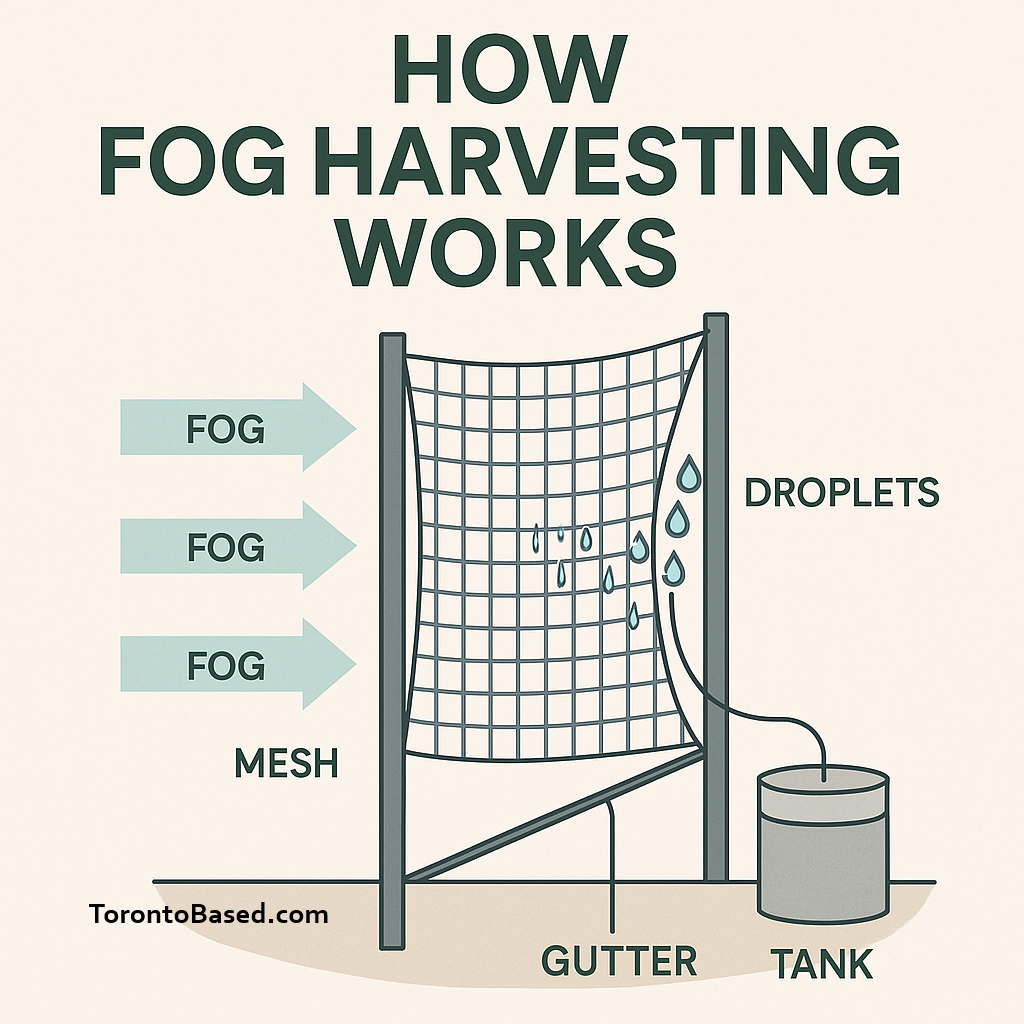
2. How Fog Nets Work

Fog is essentially a cloud at ground level, made of tiny suspended water droplets. When this moist air passes through a fine mesh, droplets collide with the fibers, merge, and drip down.

A fog-harvesting system typically consists of:

  • A vertical mesh panel, 4–10 m wide and several meters tall

  • A collection trough at the base to channel water into storage

  • Support poles and anchors to resist high winds

  • Storage tanks for collected water

Studies by Otto Klemm et al. (Ecohydrology & Hydrobiology, 2012) found that each square meter of mesh can yield 3–10 liters of water per day under good conditions. That may sound small, but on a 40 m² system, it means 120–400 liters daily — enough for a household’s needs in rural Peru.

👉 Source: Ecohydrology & Hydrobiology – Fog as a Fresh-Water Resource (PMC3357847)


3. Lima’s Hills: Communities Leading Innovation

On Lima’s outskirts, thousands of families live in hillside settlements without running water. In Villa María del Triunfo, a network of fog catchers now stretches across the ridge — shimmering green against the brown desert.

Local NGO Movimiento Peruanos Sin Agua, founded by engineer Abel Cruz, has built over 600 fog collectors in the area. Each one costs around $600–800 USD and can provide up to 400 liters of water per day. The community uses the water for washing, irrigation, and — after filtration — drinking.

According to the London School of Economics (LSE) Latin America blog, just 23 fog catchers installed in 2020 provided over 10,000 liters per day for 60 residents, surpassing the World Health Organization’s recommended per-person water minimum of 50 liters daily.

👉 Source: LSE Latin America Blog – How Fog Catchers Improve Water Scarcity


4. The Science Behind the Nets

The efficiency of fog nets depends on climate, topography, and materials.

Ideal Conditions

  • Frequent fog events (especially coastal or mountain fogs)

  • Consistent wind speeds (3–10 m/s)

  • Elevated terrain perpendicular to prevailing winds

Materials and Design

Modern fog nets use polypropylene Raschel mesh, which balances capture efficiency and drainage. Researchers have experimented with hydrophilic and cactus-inspired coatings, improving droplet adhesion and flow. The “CloudFisher” design, used in Morocco, withstands winds up to 120 km/h while capturing 30–60 liters per day per net.

👉 Source: WasserStiftung – CloudFisher Project

In Peru, similar adaptations — including cactus fiber–based coatings and improved gutter systems — have increased yields and reduced maintenance. These biomimetic approaches echo the desert plants’ natural ability to collect dew.


5. Measured Impact: Data from the Field

Location

Nets Installed

Avg. Yield

Use

Source

Villa María del Triunfo, Lima

23

~10,000 L/day

Household use

LSE Blog

Bellavista, Peru

7

2,271 L/day

Domestic water

Columbia Climate School

Atiquipa (Arequipa region)

37

2–3 L/m²/day

Irrigation, ecosystem restoration

Wikipedia – Atiquipa District

Eliseo Collazos Fog Park

6 collectors, 132 m² each

90,000 L/month

Urban irrigation

LandscapePerformance.org

These results demonstrate that fog nets can move beyond pilot projects and support long-term community infrastructure.


6. Social Dimensions: Ownership, Fairness, and Trust

As successful as the technology is, fog harvesting only endures when communities trust the process.

In earlier projects, lack of training or local ownership led to neglect and system failure. By contrast, Abel Cruz’s model prioritizes local leadership — training residents to install, maintain, and manage distribution.

The Frontiers in Water (2021) journal emphasized that social and institutional factors — governance, gender inclusion, and transparent management — are as vital as engineering performance.
👉 Source: Frontiers in Water – Review of Fog Water Harvesting Systems

This alignment of community, science, and policy fosters not only sustainability but trust — the cornerstone of any shared resource.


7. Beyond Peru: Fog Harvesting Around the World

Peru’s success has inspired similar efforts globally:

  • Chile (Atacama Desert) – Pioneering fog-catching systems since the 1990s, generating up to 10,000 liters/day for local villages.

  • Morocco (Mount Boutmezguida) – The world’s largest fog project supplies over 1,600 villagers with fresh water.

  • Eritrea & Ethiopia – Pilot projects serve schools and pastoral communities.

  • India (Rajasthan) – Researchers adapting CloudFisher models for monsoon off-seasons.

👉 Source: ActiveSustainability – Fog Catchers: A Solution for Drought

Globally, scientists estimate that scaling up fog collection in suitable zones could yield tens of millions of liters per day — enough to supplement water supply for hundreds of thousands of people.


8. Environmental and Economic Benefits

Environmental

  • No energy input: Fog nets are passive, requiring no electricity.

  • Carbon-neutral: No emissions from pumping or treatment.

  • Ecosystem support: Restores vegetation and reduces soil erosion in fog-fed “lomas.”

Economic

  • Low cost: $600–1,000 USD per collector, lasting 10+ years.

  • Low maintenance: Simple cleaning and re-tensioning.

  • Reduced dependence: Communities save up to 80% on purchased water.

Public Health

Access to clean water improves hygiene, reduces disease, and empowers women and children who often bear the burden of water collection.


9. Limitations and Real-World Challenges

Fog harvesting isn’t a silver bullet. Key limitations include:

  • Seasonal variability: Lima’s fog season lasts about eight months; production drops during hot, dry periods.

  • Maintenance needs: Dust, insects, and damage can reduce output.

  • Water quality: Fog water must be tested for airborne pollutants before consumption.

  • Scalability: Logistics for storage and distribution remain complex for larger populations.

Yet, despite these challenges, fog nets often provide a lifeline — especially in regions where no other sustainable water option exists.


10. Lessons for Policymakers and Planners

  1. Assess microclimate data before investing — fog frequency and wind direction dictate success.

  2. Incentivize local manufacturing of fog nets to reduce costs.

  3. Integrate fog harvesting into water policy under climate adaptation strategies.

  4. Create maintenance training programs and community management structures.

  5. Provide micro-finance or subsidy models to empower self-installations.

Inclusion in national climate-resilience programs could bring fog-harvesting from niche innovation to mainstream sustainability.


11. The Cactus Connection: Nature Inspires Technology

Nature has long mastered water collection. In the Peruvian desert, cacti and desert beetles capture dew and fog using micro-grooved surfaces that channel water droplets toward their roots or mouths.

Engineers now mimic these surfaces using cactus fiber coatings or hydrophilic polymers on mesh nets. Early research from arXiv (2024) demonstrates that changing fiber shape and wettability dramatically improves droplet flow and reduces clogging.

👉 Source: arXiv – Mesh Design for Fog Harvesting (2024)

By learning from desert plants, humans are building systems that can transform fog into fresh water more efficiently — using the same principles nature has used for millions of years.


12. A Model for Global Resilience

As climate change intensifies droughts, fog harvesting offers hope for communities from North Africa to South America.
It proves that sustainability doesn’t always require advanced technology — sometimes, it’s about harnessing what’s already in the air.

With proper design, community involvement, and long-term policy support, fog nets could supply millions of liters of clean water every day — helping nations achieve UN Sustainable Development Goal 6: Clean Water and Sanitation.


Conclusion: Turning Mist into Trust

The fog nets of Peru aren’t just collecting water — they’re collecting trust, dignity, and independence.
They show that resilience begins not with wealth or infrastructure, but with ingenuity and cooperation. In a world growing hotter and drier, these green nets on desert hillsides stand as a powerful reminder: even in the absence of rain, there is always hope in the air.


Full Reference List

  1. Klemm, O., Schemenauer, R., et al. “Fog as a Fresh-Water Resource.” Ecohydrology & Hydrobiology, 2012. PMC

  2. Frontiers in Water. “Fog Water Harvesting Systems: Review of Research and Practice.” 2021. Frontiers in Water

  3. LSE Latin America Blog. “How Fog Catchers Improve Water Scarcity in Urban Settlements in Peru.” 2023. LSE Blog

  4. ActiveSustainability. “Fog Catchers: A Solution for Collecting Water in Times of Drought.” ActiveSustainability.com

  5. National Geographic. “The Delicate Art of Catching Fog in the Desert.” March 2023. NationalGeographic.com

  6. Columbia Climate School. “The Fog Collectors: Harvesting Water from Thin Air.” 2011. Columbia.edu

  7. Munich Re Foundation. “Fog Nets – Harvesting Drinking Water from Fog.” MunichRe-Foundation.org

  8. WasserStiftung. “CloudFisher Project.” WasserStiftung.de

  9. ArXiv Preprint (2024). “Droplet Morphology-Based Mesh Design for Fog Harvesting.” arxiv.org/abs/2401.05284

  10. Wikipedia. “Fog Collection.” en.wikipedia.org/wiki/Fog_collection


🏡 Ready to Start Your Real Estate Journey?

Whether you're planning to buy, sell, or invest, I’m here to guide you every step of the way — surprises and all.

📈 Looking to capitalize on today’s changing market?
Explore a wide range of specialized listings with access to powerful tools and search portals tailored to your needs:

·        Stay ahead of the curve! Get the latest real estate news and insights right here.


📩 Need help navigating your options?
Reach out for expert advice and market insights:

Sami Chowdhury

BROKER
📧 Email: samichy@torontobase.com
🌐 Web: www.torontobased.com | www.torontobase.ca

Let’s make your next move a smart one!


Get more market insights here.

·        Renting vs. Owning: How $2,500/Month Could Cost You $190,000

·        Toronto & Greater Toronto Area (GTA) Housing Market — September 2025 

·        Canada’s Economy Rebounds in July: Signs of Resilience Despite U.S. Tariffs

·        GTA Housing Market Update – August 2025

·        Ontario’s Housing Crunch: What’s Really Going On

·        Canada’s Economy Stumbles in August: 66,000 Jobs Lost, Unemployment Soars to 7.1%

·        Durham Region Real Estate Market Report – July 2025

·        Hamilton Real Estate Market Update – July 2025

·        GTA Real Estate Market Report – July 2025

·        Woodbridge Square Redevelopment: Vaughan’s New Urban Vision

·        Unlock the Full Potential of 977 O’Connor Drive: A Prime Restaurant Opportunity

·        Greater Toronto Area (GTA) Housing Market Update – May 2025

·        GTA Condominium Market Analysis – April 2025

·        Ontario Eliminates Tolls on Highways 412 and 418, Extends Gas Tax Relief

·        Stay ahead of the curve! Get the latest real estate news and insights right here.


Read

Toronto & Greater Toronto Area (GTA) Housing Market — September 2025 Toronto Regional Real Estate Board (TRREB) Report: What the Numbers Mean

Market overview

TRREB (Toronto Regional Real Estate Board)’s September 2025 data show a GTA (Greater Toronto Area) market that is firmer on the sales side but still price-sensitive.

Ø  Sales rose 8.5% YoY (year over year) to 5,592,

Ø  New listings grew 4% YoY (year over year) to 19,260,

Ø  Active listings remained high at 29,394.

Ø  The average price settled at $1,059,377 (–4.7% YoY [year over year]),

Ø  MLS® HPI (Home Price Index) Composite declined 5.5% YoY (year over year).


On a seasonally adjusted basis, price levels were flat to slightly down (HPI –0.5% MoM [month over month]; average price +0.2% MoM [month over month]). In short: more deals are getting done after the Sept 17 BoC (Bank of Canada) rate cut to 2.50%, but buyers still have leverage. (Toronto Regional Real Estate Board)

Price, sales, and listings trends (YoY [year over year] and MoM [month over month])

  • Sales: 5,592 (Sep-25) vs 5,155 (Sep-24): +8.5% YoY (year over year). Lower borrowing costs combined with accumulated demand from spring/summer helped momentum. (Toronto Regional Real Estate Board)

  • New listings: 19,260 (Sep-25), +4% YoY (year over year); SNLR (Sales-to-New-Listings Ratio) ≈ 34.6%, indicating conditions favourable to buyers in many sub-markets. (Toronto Regional Real Estate Board)

  • Active listings: 29,394, sustaining MOI (Months of Inventory) ≈ 4.6, a level historically consistent with balanced to slightly buyer-tilted conditions. (Toronto Regional Real Estate Board)

  • Prices: Average price $1,059,377 (–4.7% YoY [year over year]);

  • HPI (Home Price Index) Composite –5.5% YoY (year over year);

  • MoM (month over month): HPI –0.5%, average +0.2% —. (Toronto Regional Real Estate Board)

Market pace & absorption

  • LDOM (Listing Days on Market) ~33;

  • PDOM (Property Days on Market) ~51:

    • Listings take about a month, but cumulative time for re-listed properties is longer. That corroborates a bid-ask gap that narrows via price adjustments or concessions. (Toronto Regional Real Estate Board)

Segment breakdown (Detached / Semi / Town / Condo)

  • Detached: $1,359,030 average  [Toronto Regional Real Estate Board] total) on 2,661 sales. Freehold remains the “needs-based” segment; pricing is micro-neighbourhood specific with bigger swings in luxury bands. (Toronto Regional Real Estate Board)

  • Semi-detached: $1,297,830 on 506 sales — smaller sample sizes create more volatility; well-renovated semis in the 416 (Toronto core area code) continue to command premiums. (Toronto Regional Real Estate Board)

  • Townhouse (att/row): $1,015,543 on 517 sales — the “missing middle” alternative offers price efficiency but competes with detached at the margin when rates ease. (Toronto Regional Real Estate Board)

  • Condo apartment: $681,115 on 1,437 sales — the price leader for entry buyers and investors, but facing inventory pressure and investor cash-flow math. (Toronto Regional Real Estate Board)

City (416) vs 905 notes

416 (Toronto core) condo pricing is modestly higher than 905 (surrounding GTA suburbs) (e.g., condo apartment $681,115 in 416 vs $653,407 in 905 during September), reflecting location premiums and amenity density. Freehold premiums persist in central corridors with constrained lot supply. (Toronto Regional Real Estate Board)


References


🏡 Ready to Start Your Real Estate Journey?

Whether you're planning to buy, sell, or invest, I’m here to guide you every step of the way — surprises and all.

📈 Looking to capitalize on today’s changing market?
Explore a wide range of specialized listings with access to powerful tools and search portals tailored to your needs:


·        Stay ahead of the curve! Get the latest real estate news and insights right here.


📩 Need help navigating your options?
Reach out for expert advice and market insights:

Sami Chowdhury

BROKER
📧 Email: samichy@torontobase.com
🌐 Web: www.torontobased.com | www.torontobase.ca

Let’s make your next move a smart one!


Get more market insights here.


·        Renting vs. Owning: How $2,500/Month Could Cost You $190,000

·        Canada’s Economy Rebounds in July: Signs of Resilience Despite U.S. Tariffs

·        GTA Housing Market Update – August 2025

·        Ontario’s Housing Crunch: What’s Really Going On

·        Canada’s Economy Stumbles in August: 66,000 Jobs Lost, Unemployment Soars to 7.1%

·        Durham Region Real Estate Market Report – July 2025

·        Hamilton Real Estate Market Update – July 2025

·        GTA Real Estate Market Report – July 2025

·        Woodbridge Square Redevelopment: Vaughan’s New Urban Vision

·        Unlock the Full Potential of 977 O’Connor Drive: A Prime Restaurant Opportunity

·        Greater Toronto Area (GTA) Housing Market Update – May 2025

·        GTA Condominium Market Analysis – April 2025

·        Ontario Eliminates Tolls on Highways 412 and 418, Extends Gas Tax Relief

·        Stay ahead of the curve! Get the latest real estate news and insights right here.


Read

B.C. Court Voids $57K Tenant Windfall: What Really Happened, Why It Matters, and What It Means Going Forward

Summary and High-Level Takeaways

A British Columbia Supreme Court judge recently overturned a $57,700 award that the RTB had granted to a tenant. The initial award was for 12 months’ rent, based on a claim that the landlord had ended the tenancy in bad faith (claiming the unit for renovation or use). But the court found the hearing process was unfair because the tenant intentionally mis-served the notice—sending it to a wrong address and preventing the landlord from participating. The result: the award was quashed, and the tenant was ordered to pay the landlord’s legal costs plus $3,500 in special costs as a penalty.

Two legal pillars led to this outcome:

  1. RTB Service Rules — The Residential Tenancy Branch requires strict, prescribed methods for serving notices (in person, agent, or registered mail). If none are feasible, one must obtain substituted service permission. (See “Serve notice for dispute resolution” guide)

  2. Procedural Fairness — Courts require that individuals affected by decisions receive proper notice and a fair opportunity to respond. A hearing conducted without giving one side meaningful notice is fundamentally unfair.


Timeline of Events in the Case

  • 2021: The tenant and landlord entered into a fixed-term lease that would end in 2023, with the landlord’s stated purpose to renovate thereafter.

  • Late 2022 to March 2023: The tenant stopped paying rent, was issued a 10-Day Notice to End Tenancy, and vacated the unit. (Money.ca provides background)

  • September 2023: The tenant applied to the RTB and won the dispute by default (landlord was absent).

  • September 2025: On judicial review, the Supreme Court (Justice Hoffman) quashed the RTB award due to procedural unfairness. The tenant was saddled with legal costs and a punitive penalty.


How Service Rules Led to the Award’s Undoing

Under B.C. law, serving a “Notice of Proceeding” properly is essential. The rules are detailed in the government’s “Serve notice for dispute resolution” guide:

In the case in question, the court determined the tenant deliberately mailed the notice to an incorrect address, meaning the landlord never had a real chance to appear or defend. That tactic crossed the line from asserting a claim to frustrating fairness. The court held this was a process violation serious enough to void the entire award.


Why the Courts Override RTB Decisions in Some Cases

The RTB is an expert tribunal with authority to adjudicate many landlord–tenant disputes. Courts generally defer to such tribunals on factual or technical questions. Yet, courts will intervene if:

  • Notice was deficient or misdelivered

  • One side was denied the chance to respond

  • Evidence was withheld

  • Basic fairness principles were violated

In this case, because the landlord was effectively kept out of the hearing, the court found the process so flawed that no amount of factual correctness could fix it. The default award, however favorable to the tenant, could not survive procedural unfairness.


Proposal: Punitive Measures Against Dishonest Service

There should be punitive consequences when either party—tenant or landlord—intentionally flouts any rules to gain advantage. In this case, the court already imposed “special costs” on the tenant ($3,500) above normal costs as a penal measure. This is a start.
But more consistent, visible penalties—like fines, reduction of claims, or bar from reapplying for substituted service—would deter dishonest conduct and protect the integrity of the process for all parties.


Practical Tips & Compliance Checklist

For Landlords

  • Always keep your mailing and business address current in lease and RTB filings.

  • Keep a log of tenant communications: letters, emails, texts.

  • If you believe a decision was made without your knowledge, apply promptly for judicial review (within the time limit, often 60 days). (Supreme Court BC)

For Tenants

  • Follow service rules exactly—no shortcuts or guesswork.

  • If you can’t locate the other party, apply for substituted service and retain a copy of that order.

  • Keep proofs of service (receipts, affidavits, etc.).

  • Know that if you mislead the tribunal or fail to properly serve, you may lose not only your claim, but be penalized.


🏡 Ready to Start Your Real Estate Journey?

Whether you're planning to buy, sell, or invest, I’m here to guide you every step of the way — surprises and all.

📈 Looking to capitalize on today’s changing market?
Explore a wide range of specialized listings with access to powerful tools and search portals tailored to your needs:


📩 Need help navigating your options?
Reach out for expert advice and market insights:

Sami Chowdhury

BROKER
📧 Email: samichy@torontobase.com
🌐 Web: www.torontobased.com | www.torontobase.ca

Let’s make your next move a smart one!


Get more market insights here.


Read

Home Is a Balance Sheet: Why 2025 Feels Different for Canada’s Renters and Buyers

In 2025, the rent-versus-own decision in Canada is no longer a one-way argument. After years when rents surged and borrowing costs climbed, the landscape has shifted: the Bank of Canada has lowered its policy rate to 2.50% (Sept. 17, 2025), easing the cost of money and resetting expectations about what ownership might look like over the next cycle. (Bank of Canada)

But lower rates don’t mean a free-for-all. Canadian mortgage borrowers still face a strict minimum qualifying rate (MQR)—the greater of the contract rate plus 2 percentage points or 5.25%—a safeguard designed to ensure households can handle potential payment shocks. That rule shapes budgets, price ceilings, and timelines, especially for first-time buyers watching every dollar. (OSFI)

Meanwhile, rents—once the headline story of 2022–2023—have cooled. Nationally, asking rents have posted a string of year-over-year declines through mid-to-late 2025, with recent reports placing the average at roughly $2,123–$2,137 and marking the 11th–12th straight month of annual declines. That shift follows a long climb and signals a more balanced market for tenants than many expected a year ago. (Rentals.ca)

On prices, the national non-seasonally adjusted average sat near $664,078 in August 2025, up 1.8% year-over-year—hardly the frenzy of prior years, but not capitulation either. It’s the posture of a market catching its breath, with regional differences that matter far more than any single national number. (CREA)

What does this mean in human terms? For a household deciding between another lease and a purchase, the choice is less about chasing a perfect market call and more about reading one’s own life horizon. Renting buys optionality—the right to move for a new job, to pause and build a larger down payment, to keep cash liquid in an uncertain economy. Ownership buys permanence and a disciplined savings habit: every mortgage payment chips away at principal, and every year of inflation nudges replacement costs and (often) property values upward. But permanence brings volatility: property taxes rise and fall with assessments, furnaces fail in February, and condo reserve studies occasionally insist on bigger monthly fees.

This emotional and financial calculus plays out differently across the country. In Toronto and Vancouver, even with rents softening, the gap between monthly rent and the full carrying cost of ownership (mortgage, taxes, insurance, and fees) can be wide; in these markets, buying typically shines over longer horizons where principal repayment and gradual appreciation have time to work. In Calgary, Edmonton, Winnipeg, Quebec City, Regina, and Saskatoon, lower purchase prices compress that gap, allowing ownership math to “win” sooner for households that are stable and intend to stay put. In university and government hubs like Ottawa, Kingston, and Halifax, rents have stabilized relative to their recent peaks, and vacancy is expected to edge higher in 2025—context that can tilt near-term decisions toward renting if flexibility is paramount.

Market update

The new balance of 2025 is this: neither path is “wrong.” Instead, there are right timelines and right cash-flow buffers for each path. If your next six to eight years look anchored—career, schools, community—homeownership often becomes a quiet wealth engine, partly because of the forced savings effect (principal paydown) and partly because of time in the market, not timing the market. If your life is mobile or your cash cushion is thin, renting while you build savings and watch conditions normalize is not only prudent—it’s strategic.

There is also a broader policy backdrop to consider. The BoC isn’t cutting rates to reignite speculation; it’s trying to balance risks in an economy marked by slower growth and a softer labour market, even as inflation pressures ebb from their peaks. Rate cuts have reopened the conversation for many would-be buyers, but the stress test keeps that conversation grounded in what households can withstand over a full cycle. Together, those two forces define the new middle path of 2025: measured optimism for buyers with solid buffers, renewed breathing room for renters who need time to plan. (Bank of Canada)

If you’re weighing the decision today, treat your housing choice like a portfolio move:

  • Run the math at the MQR to see how much margin you truly have. (OSFI)

  • Stress test your cash flow for taxes, insurance, maintenance, and condo fees; build an emergency fund for repairs.

  • Model a realistic horizon (5–7+ years) that allows appreciation and amortization to matter.

  • Compare local rents with total ownership costs—not just the mortgage payment. In some cities, the rent discount in 2025 buys meaningful flexibility; in others, the ownership premium may be smaller than you think given today’s rates and flat price trends. (Rentals.ca)

In short: renting is not “throwing money away”—it’s buying time and choice. Owning is not “always better”—it’s a commitment to a place and a balance sheet. The right answer in 2025 depends on your city, your cash flow, and your story. For many Canadians who expect to stay, owning still compounds quietly in the background. For those in motion, renting is the right tool for the season you’re in. This year, Canada finally offers room for both truths to be true.


Sources & Reference Links

Optional corroboration:


🏡 Ready to Start Your Real Estate Journey?

Whether you're planning to buy, sell, or invest, I’m here to guide you every step of the way — surprises and all.

📈 Looking to capitalize on today’s changing market?
Explore a wide range of specialized listings with access to powerful tools and search portals tailored to your needs:


·        Stay ahead of the curve! Get the latest real estate news and insights right here.


📩 Need help navigating your options?
Reach out for expert advice and market insights:

Sami Chowdhury

BROKER
📧 Email: samichy@torontobase.com
🌐 Web: www.torontobased.com | www.torontobase.ca

Let’s make your next move a smart one!


Get more market insights here.


·        Renting vs. Owning: How $2,500/Month Could Cost You $190,000

·        Canada’s Economy Rebounds in July: Signs of Resilience Despite U.S. Tariffs

·        GTA Housing Market Update – August 2025

·        Ontario’s Housing Crunch: What’s Really Going On

·        Canada’s Economy Stumbles in August: 66,000 Jobs Lost, Unemployment Soars to 7.1%

·        Durham Region Real Estate Market Report – July 2025

·        Hamilton Real Estate Market Update – July 2025

·        GTA Real Estate Market Report – July 2025

·        Woodbridge Square Redevelopment: Vaughan’s New Urban Vision

·        Unlock the Full Potential of 977 O’Connor Drive: A Prime Restaurant Opportunity

·        Greater Toronto Area (GTA) Housing Market Update – May 2025

·        GTA Condominium Market Analysis – April 2025

·        Ontario Eliminates Tolls on Highways 412 and 418, Extends Gas Tax Relief

·        Stay ahead of the curve! Get the latest real estate news and insights right here.


Read

CPKC Holiday Train 2025 — Schedule, Impact, and Why It Matters for Toronto & Beyond

What’s happening in 2025
The CPKC Holiday Train returns November 19–December 21, 2025, sending two illuminated trains to 196 communities across Canada and the U.S. The Canadian leg launches in Montréal and ends in Gleichen, Alberta; the U.S. leg runs Hermon, Maine to Kenmare, North Dakota. Each stop features a short, free concert from the side of a railcar, with the audience encouraged to donate to the local food bank. CPKCR+2Trains+2

Toronto & GTA context
Toronto typically draws strong turnout, with prior years seeing evening crowds and west-end yard appearances. Exact 2025 stop details and times are set on the official CPKC schedule PDFs and can shift due to operations, so residents should verify the latest times before heading out. gis.cpkcr.com

The model: free shows, local impact
Holiday Train shows are free, but the program asks for food or monetary donations for local food banks. Over 26 years, the train has raised $26M+ and collected 5.4M+ pounds of food—numbers that place it among the country’s most visible seasonal corporate-community partnerships. Progressive Railroading

Why it matters

  1. Awareness & timing: Food banks see heightened need in Q4; a marquee event in late November/December drives both donations and media visibility. 2) Local multipliers: Dollars collected stay with the local food bank partners, which can stretch cash farther than retail shoppers due to wholesale procurement. 3) Place-making: Bringing music to rail sidings creates family-friendly “micro-festivals” that activate under-used public-industrial spaces for a night. CPKCR

Operations & reliability
Trains are sensitive to weather and network conditions. CPKC publishes real-time updates and encourages checking channels the day of a show. That’s especially relevant in the GTA where yard access, safety perimeters, and strong turnout can affect crowd control and parking. CPKCR

Performers & programming
Lineups rotate by region and date; 2025 performers include American Authors among others, with CPKC’s site and rail media listing artists by stop. Families can expect 25–30 minute sets with seasonal songs and originals, plus on-car lighting displays. Trains

Best practices for attendees

  • Check the official schedule PDF for exact time and location; arrive early.

  • Bring a donation—non-perishables or cash for the partner food bank.

  • Dress for weather and plan your transit; parking near yards is limited. gis.cpkcr.com+1

Long-term implications
The Holiday Train’s durability suggests a template for corporate citizenship: consistent annual cadence, hyper-local partners, and tangible outcomes. For Toronto, the program functions as a seasonal civic ritual alongside the Santa Claus Parade and neighborhood light festivals, broadening the city’s holiday calendar with an all-ages, donation-first event that requires no ticket and little planning beyond warm clothing and a can of soup. Wikipedia

Key links

Sources & references

  • Official overview & lineup — CPKC Holiday Train page (tour dates, purpose, how donations work). CPKCR

  • Official media release — 2025 schedule and artists announced Oct 9, 2025. CPKCR

  • Trade/rail coverageTrains.com report on 196 locations and performers. Trains

  • Impact totals since 1999 — CPKC stats and Progressive Railroading round-up. Progressive Railroading

  • FAQs & live updates — CPKC Holiday Train FAQs and social channels. CPKCR

  • Route PDFs — Canada and U.S. 2025 schedule maps. gis.cpkcr.com+1

  • Context for Toronto seasonal events — Toronto Santa Claus Parade overview. Wikipedia


🏡 Ready to Start Your Real Estate Journey?

Whether you're planning to buy, sell, or invest, I’m here to guide you every step of the way — surprises and all.

📈 Looking to capitalize on today’s changing market?
Explore a wide range of specialized listings with access to powerful tools and search portals tailored to your needs:


·        Stay ahead of the curve! Get the latest real estate news and insights right here.


📩 Need help navigating your options?
Reach out for expert advice and market insights:

Sami Chowdhury

BROKER
📧 Email: samichy@torontobase.com
🌐 Web: www.torontobased.com | www.torontobase.ca

Let’s make your next move a smart one!


Get more market insights here.


·        Renting vs. Owning: How $2,500/Month Could Cost You $190,000

·        GTA Housing Market Update – August 2025

·        Ontario’s Housing Crunch: What’s Really Going On

·        Canada’s Economy Stumbles in August: 66,000 Jobs Lost, Unemployment Soars to 7.1%

·        Durham Region Real Estate Market Report – July 2025

·        Hamilton Real Estate Market Update – July 2025

·        GTA Real Estate Market Report – July 2025

·        Woodbridge Square Redevelopment: Vaughan’s New Urban Vision

·        Unlock the Full Potential of 977 O’Connor Drive: A Prime Restaurant Opportunity

·        Greater Toronto Area (GTA) Housing Market Update – May 2025

·        GTA Condominium Market Analysis – April 2025

·        Ontario Eliminates Tolls on Highways 412 and 418, Extends Gas Tax Relief

·        Stay ahead of the curve! Get the latest real estate news and insights right here.


Read
This website may only be used by consumers that have a bona fide interest in the purchase, sale, or lease of real estate of the type being offered via the website. The data relating to real estate on this website comes in part from the MLS® Reciprocity program of the PropTx MLS®. The data is deemed reliable but is not guaranteed to be accurate.